What Is the Ishikawa Diagram
Let's begin with the Ishikawa method. It focuses on analyzing cause-and-effect relationships.
Kaoru Ishikawa, the Japanese professor who developed this method in the mid-20th century, became well-known for his contributions to quality and management standards. His ideas were instrumental in helping Toyota overcome a crisis and become a global leader.

The main goal of this method is to identify obvious causes and uncover hidden ones that may contribute to a problem. It also helps predict future developments based on the findings.
📌 The Ishikawa Diagram is a visual representation used to analyze and evaluate cause-and-effect relationships in workflows.
It enables users to see a variety of interconnected factors on one chart. The diagram is particularly effective for risk analysis, both for identifying risks that have occurred and those that may arise.
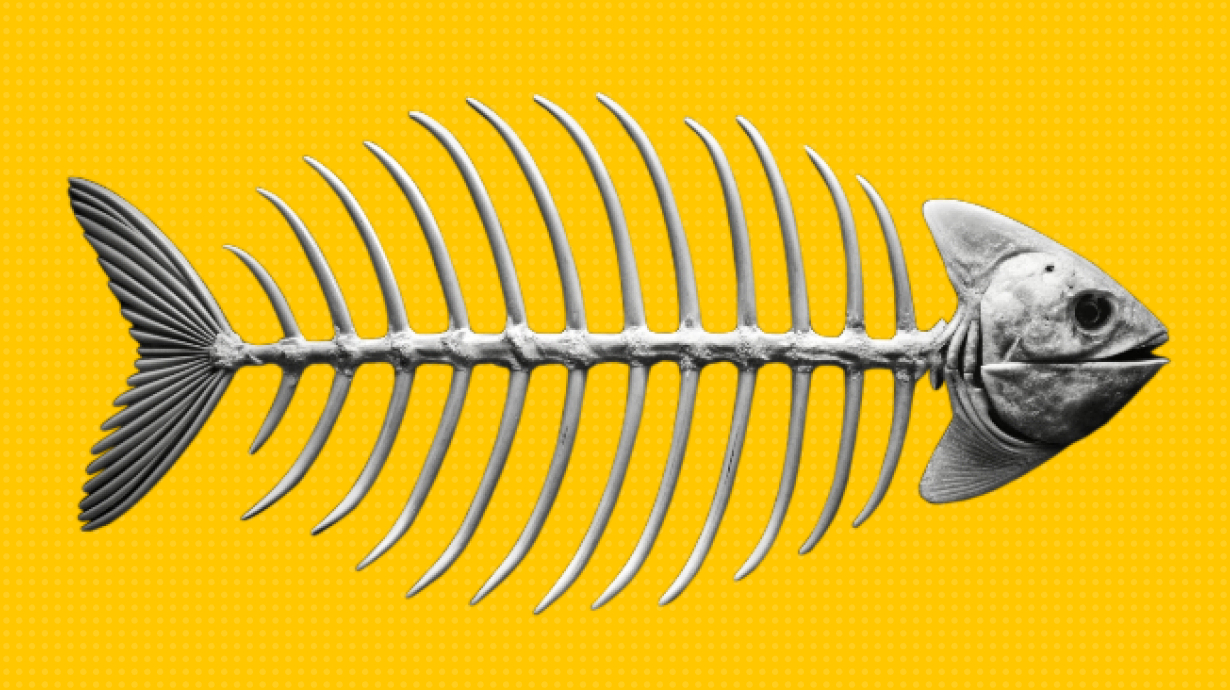
Due to its resemblance to a fish skeleton, it's commonly referred to as the "fishbone diagram." The diagram highlights the main issue being analyzed—the "head of the fish"—and displays causes and effects branching out from the central axis, similar to bones extending from a fish’s spine.
Components of the Ishikawa Diagram
Let’s explore the structure of the "fish skeleton."
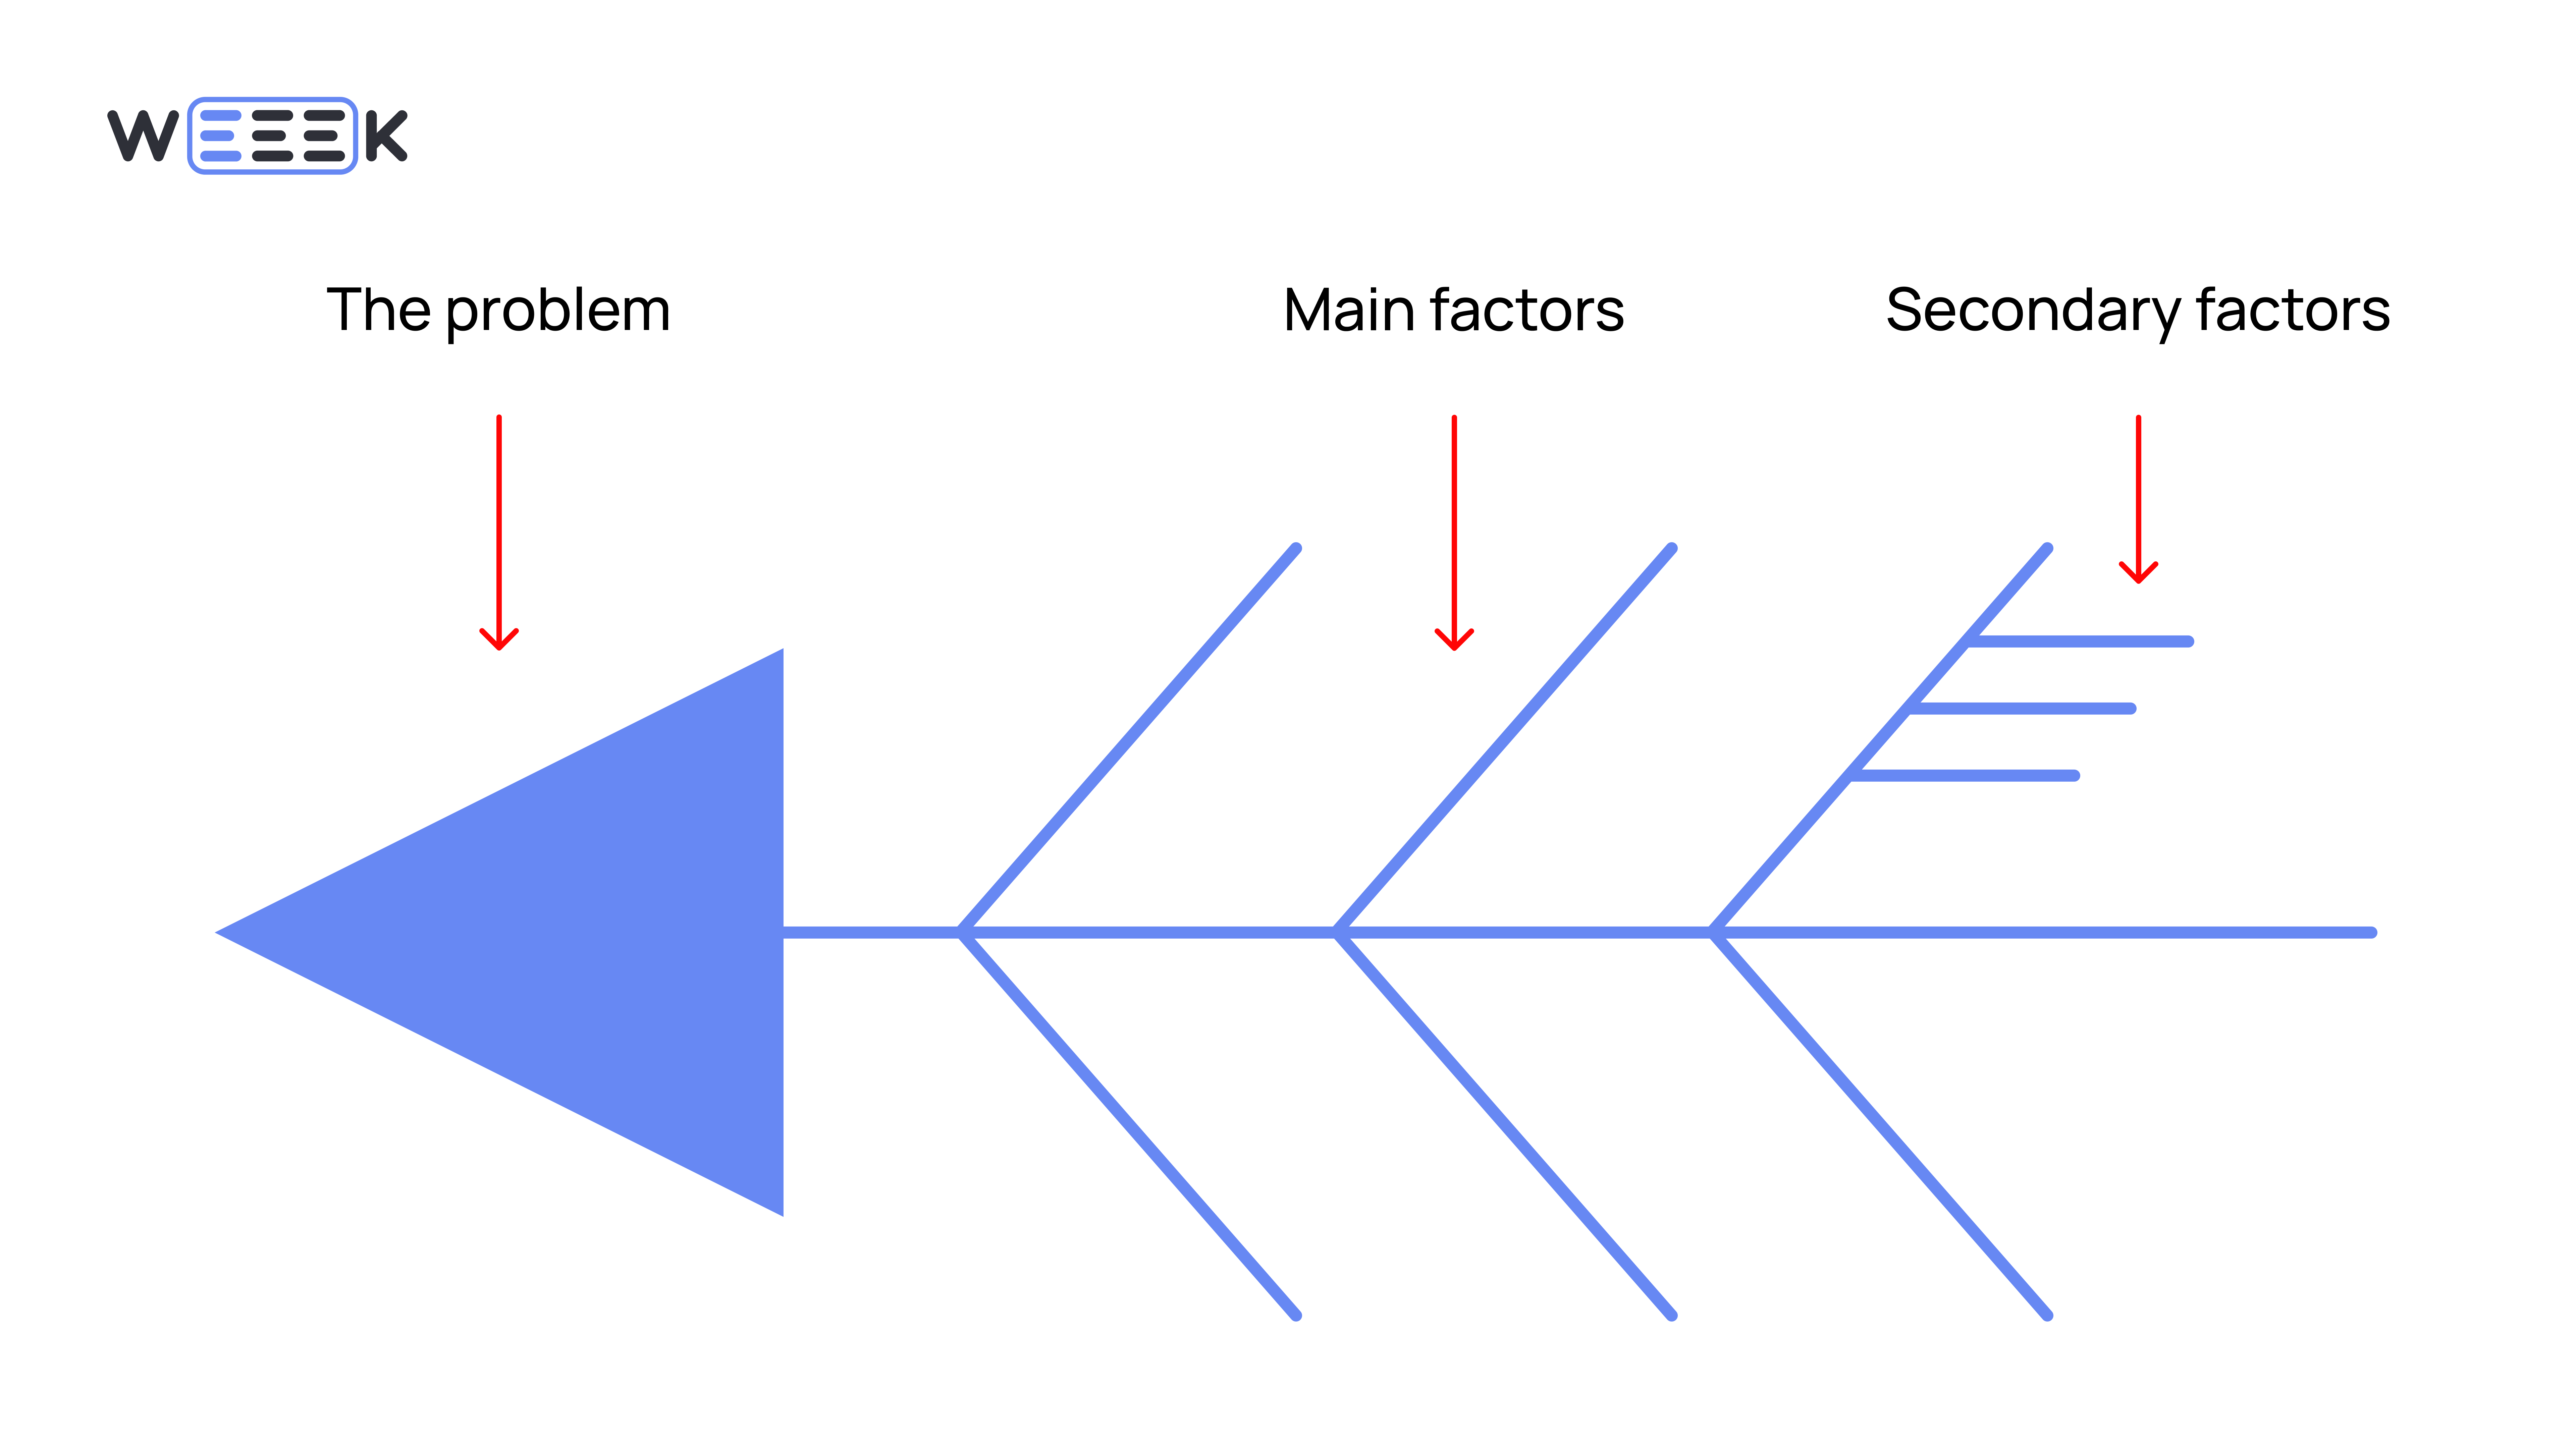
The fish’s head represents the topic of analysis, or the main problem. This is the central issue that needs to be broken down. It forms the focus of the investigation, both visually and conceptually.
The spine, or backbone, is a horizontal line where angled branches—representing the key causes, or "fishbones"—are attached. These branches are positioned at an angle for easier organization and analysis.
Problems often arise from a combination of factors that are intertwined. To address the issue, each factor needs to be identified and analyzed. The key causes help pinpoint the areas where solutions can be found and who is responsible.
Smaller bones are connected to the larger ones, representing more specific or secondary causes. Although there can be multiple layers of detail, two levels of causes are typically enough. These secondary causes help clarify what exactly needs to be changed and who is accountable for making those changes.
Why the Ishikawa Diagram Is Useful
The Ishikawa Diagram is a powerful analytical tool that can help:
- Identify bottlenecks in large, well-established processes
- Provide a fresh perspective on events, problems, and risks
- Analyze situations in an unconventional way
- Discover solutions that are highly likely to be effective
- Uncover the root causes of problems or realized risks
Additionally, the diagram helps break down complex processes into their individual components, making it easier to analyze each factor.
It can be used for:
- Employee responsibility analysis — gaining a clear understanding of who is accountable for what within the company
- Product analysis — a detailed examination of a product's condition, including its strengths and weaknesses
- Strategic development analysis — using factual data to "forecast the future." By examining possible development paths, the diagram helps identify potential risks, uncover their causes, and consider their consequences.
How to Build an Ishikawa Diagram
The Ishikawa Diagram is created through data collection and analysis. Here’s how to build it step by step:
Step 1: Define the Main Topic
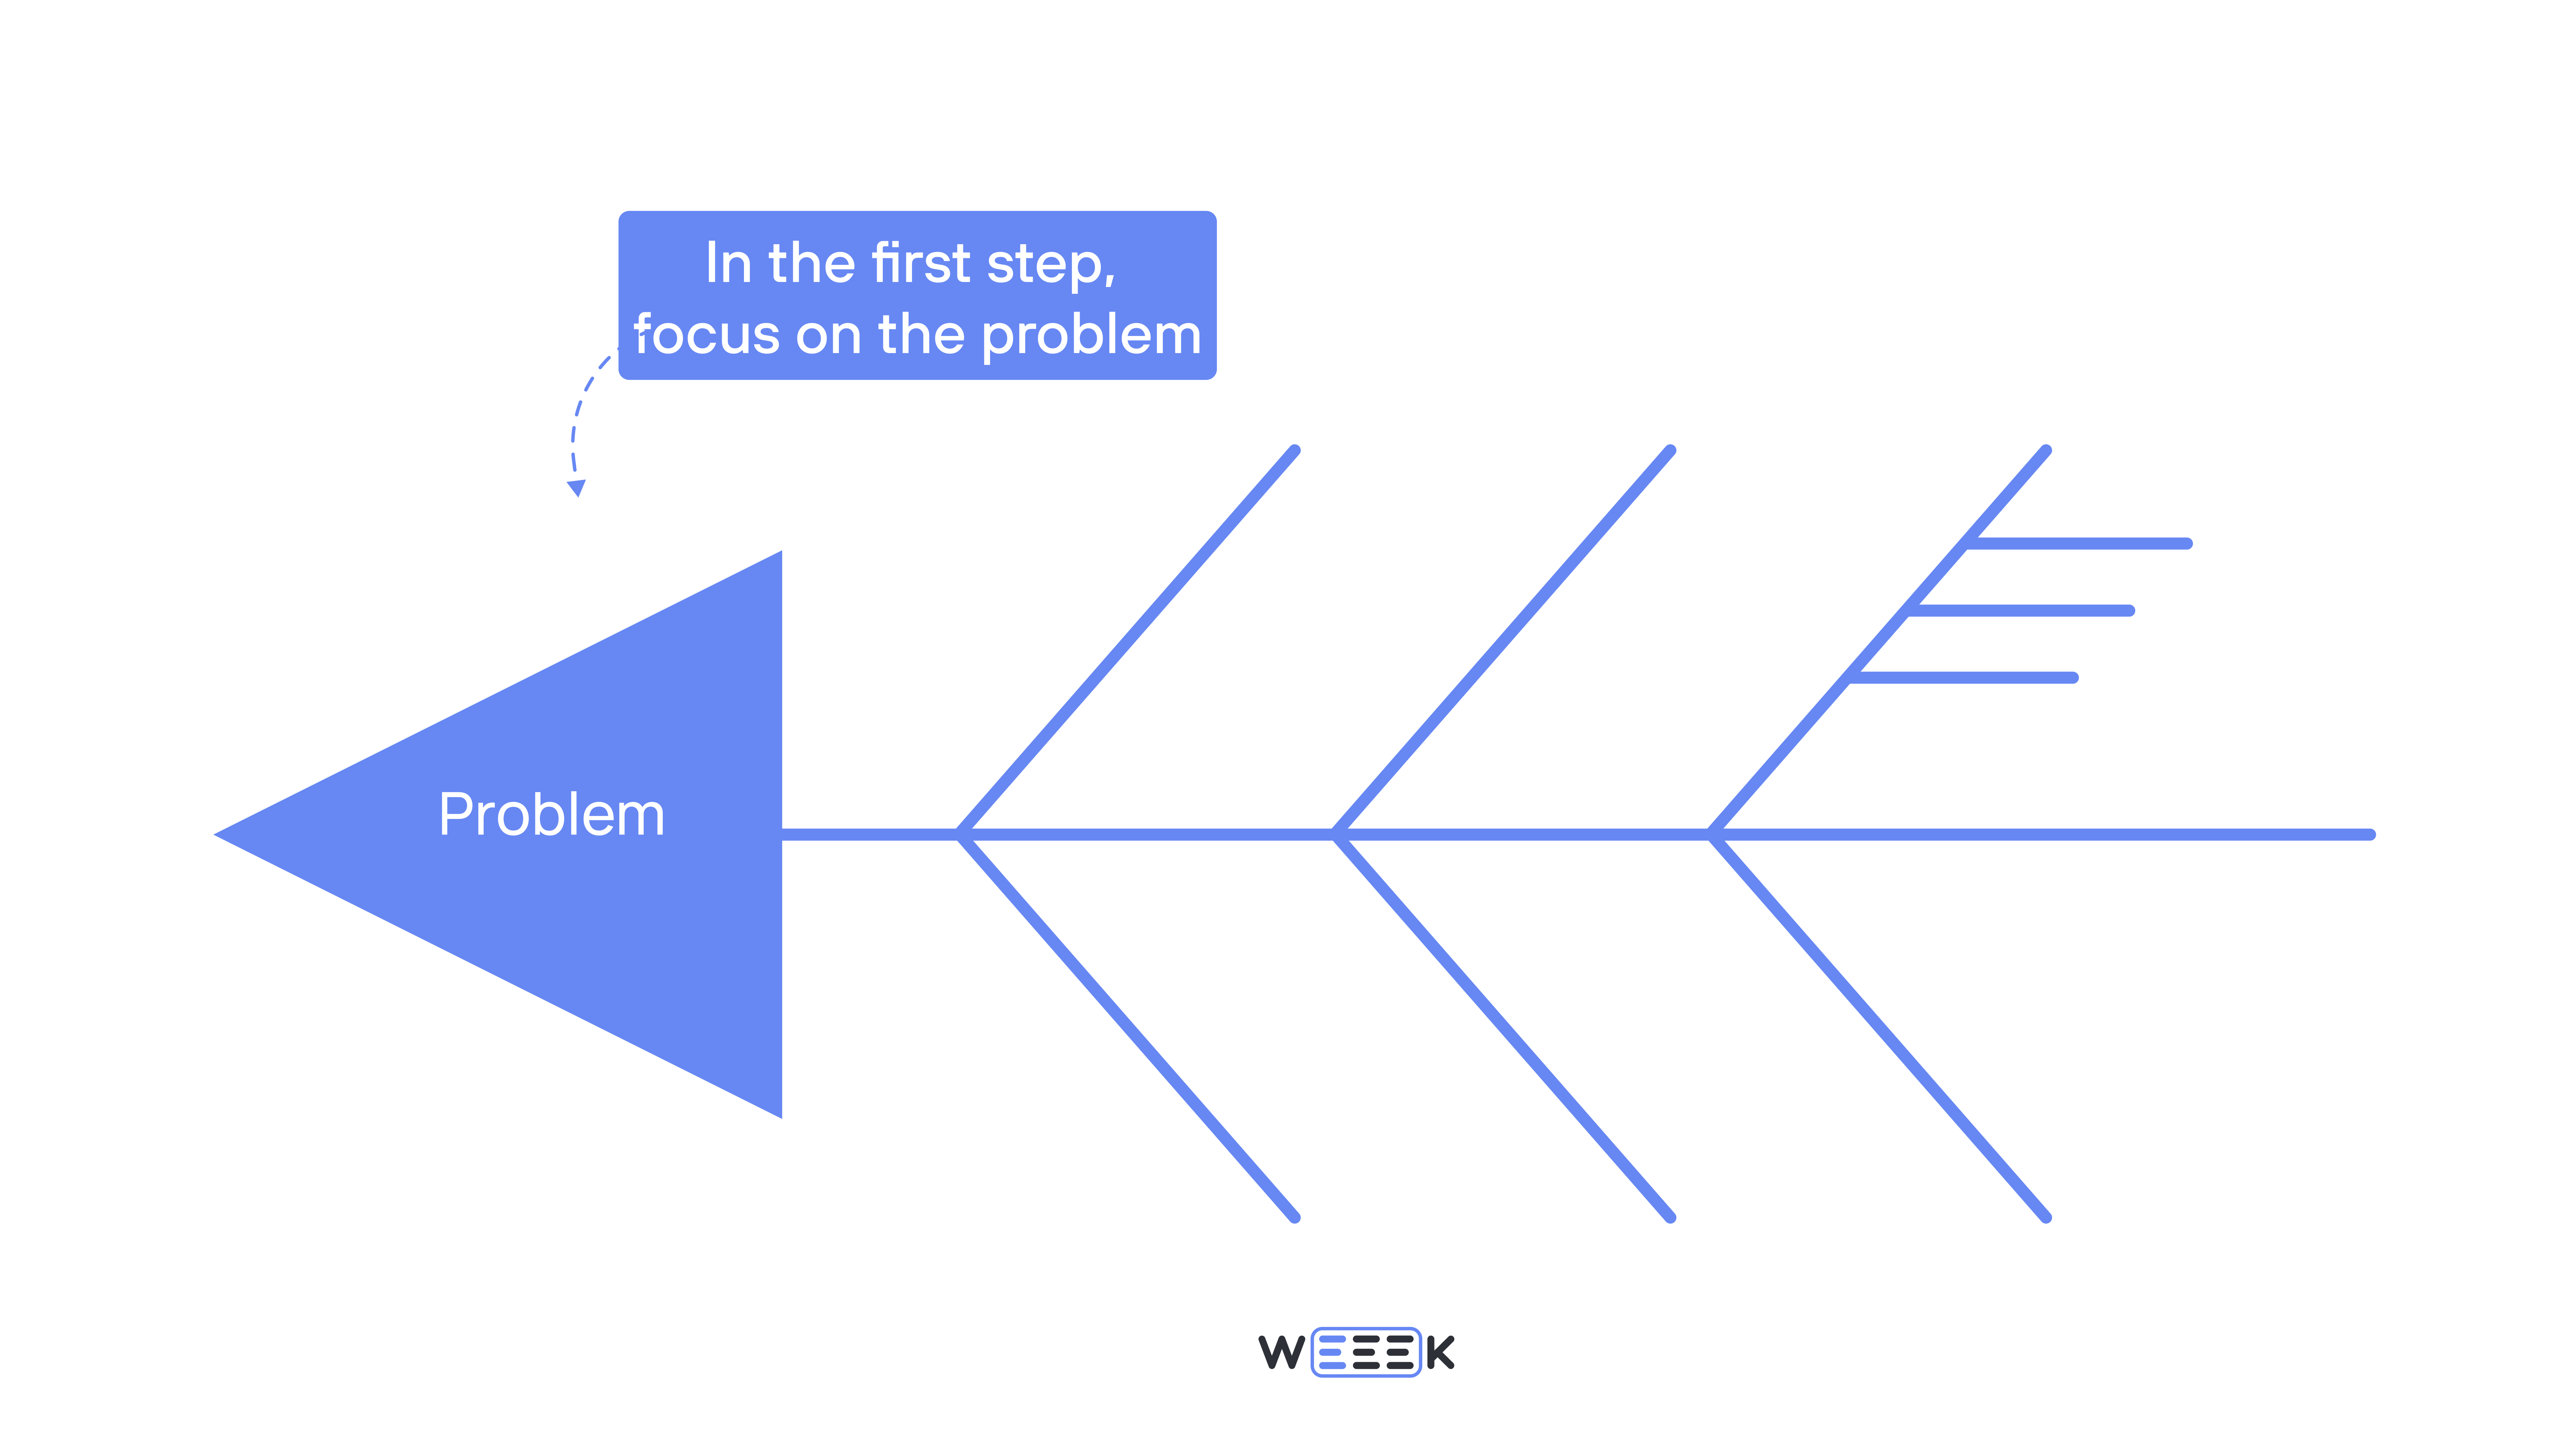
This is the issue you want to investigate—whether it's a risk that materialized, a problem that needs solving, or a situation your team wants to understand. The goal is to figure out why something happened and how to address it.
For example:
- The sales funnel isn’t performing—there are too few sales.
- Production has slowed—we’re missing our targets.
- Fewer people attended the event than expected—it wasn’t profitable.
It’s often helpful to conduct a brainstorming session or a quick team discussion to identify the issue that requires attention.
Write this topic at the beginning of the diagram—this is the "head of the fish."
Step 2: Identify Key Causes or Factors Contributing to the Problem
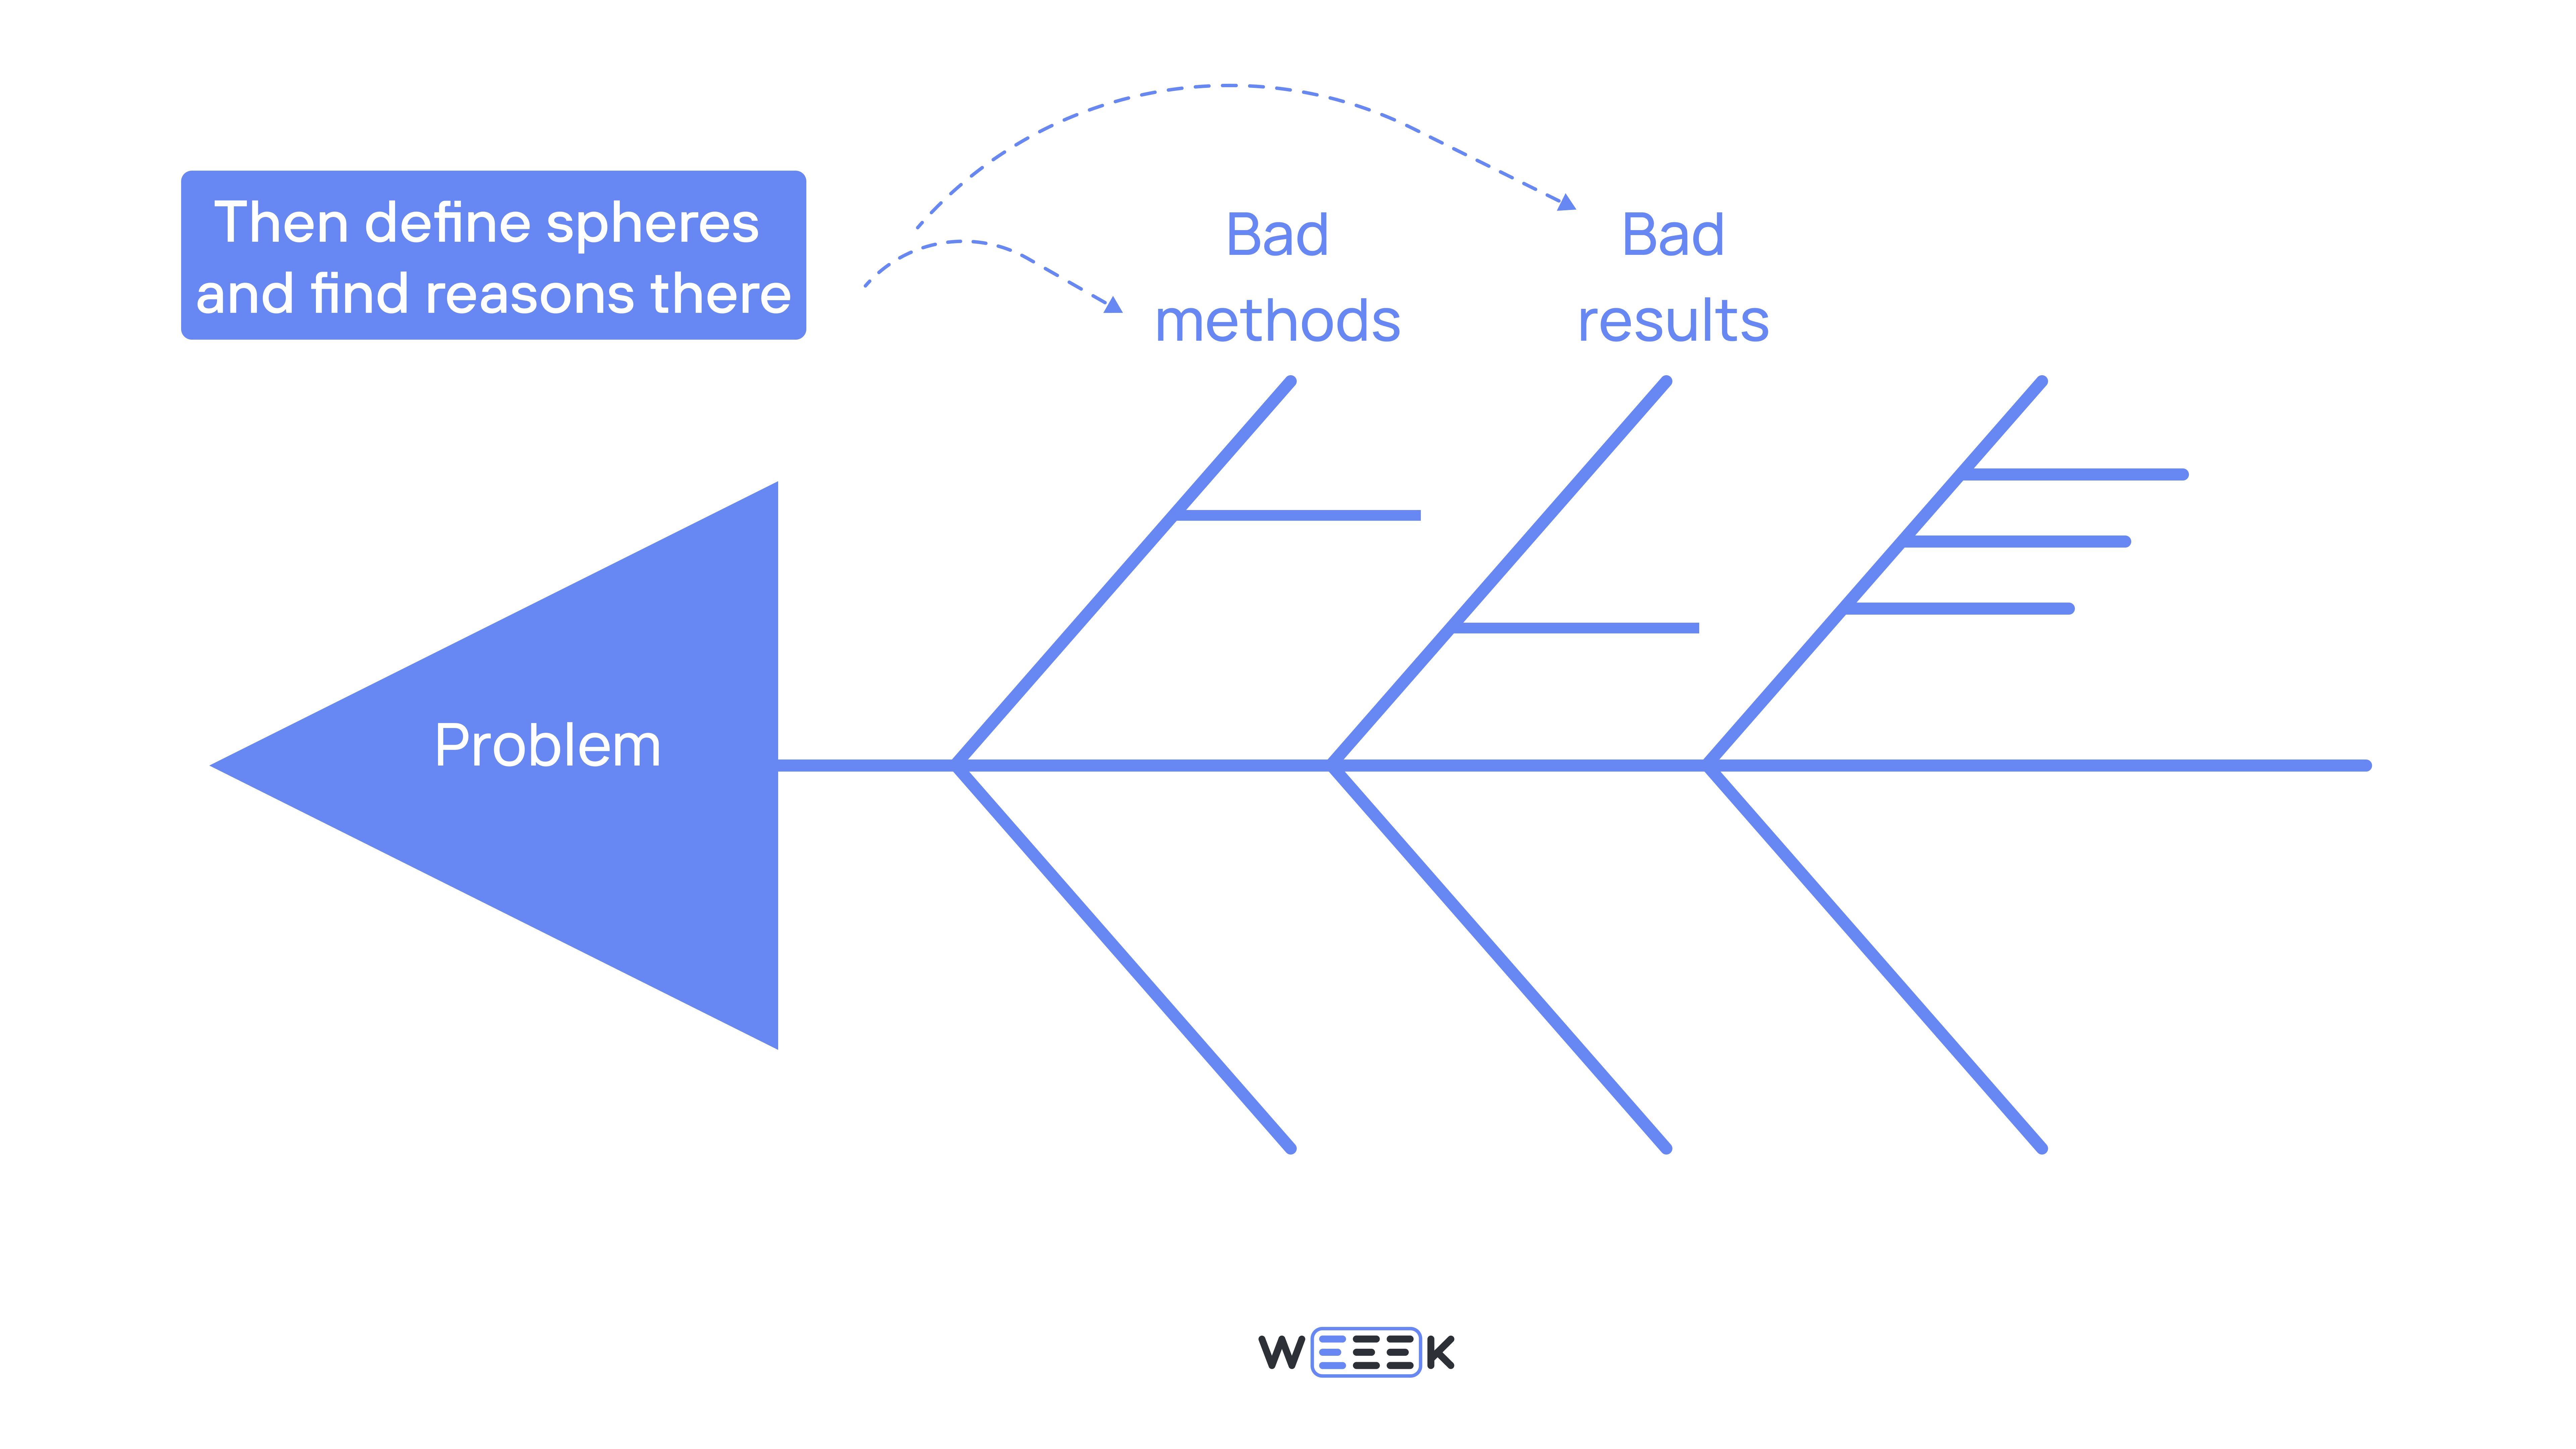
Ishikawa initially recommended investigating six key areas: organization methods, materials, equipment, human resources, environment, and metrics.
These categories were originally focused on manufacturing. However, the modern business environment is broader, and the diagram can be applied across various industries, so it’s important to adapt these areas to what’s relevant to your company.
Let’s use Ishikawa’s six classic areas:
- Organization methods — processes, methodologies, tools, decision-making speed. Consider what might be causing the problem in this area.
- Materials — tools, software, and other resources the team uses, as well as the speed of handling changes.
- Equipment — physical equipment (e.g., computers), or event-related equipment if applicable.
- Human resources — team size, level of expertise, knowledge, experience, etc.
- Environment — external and internal factors, market conditions, etc.
- Metrics — key performance indicators (KPIs) and other business growth or decline metrics.
These key causes are written on the diagram’s "bones" that are attached to the main spine.
💡 Encourage more in-depth discussions by asking, "What else might have contributed to this?"
Step 3: Break Down the Causes into Subcomponents
To dig deeper into the causes, you’ll need input from team members who are directly involved. It’s important to avoid assumptions and focus on finding the real root causes.
Any relevant data can be used in this analysis—these are the smaller bones of the diagram. Write each one down, "attaching" it to its corresponding larger bone.
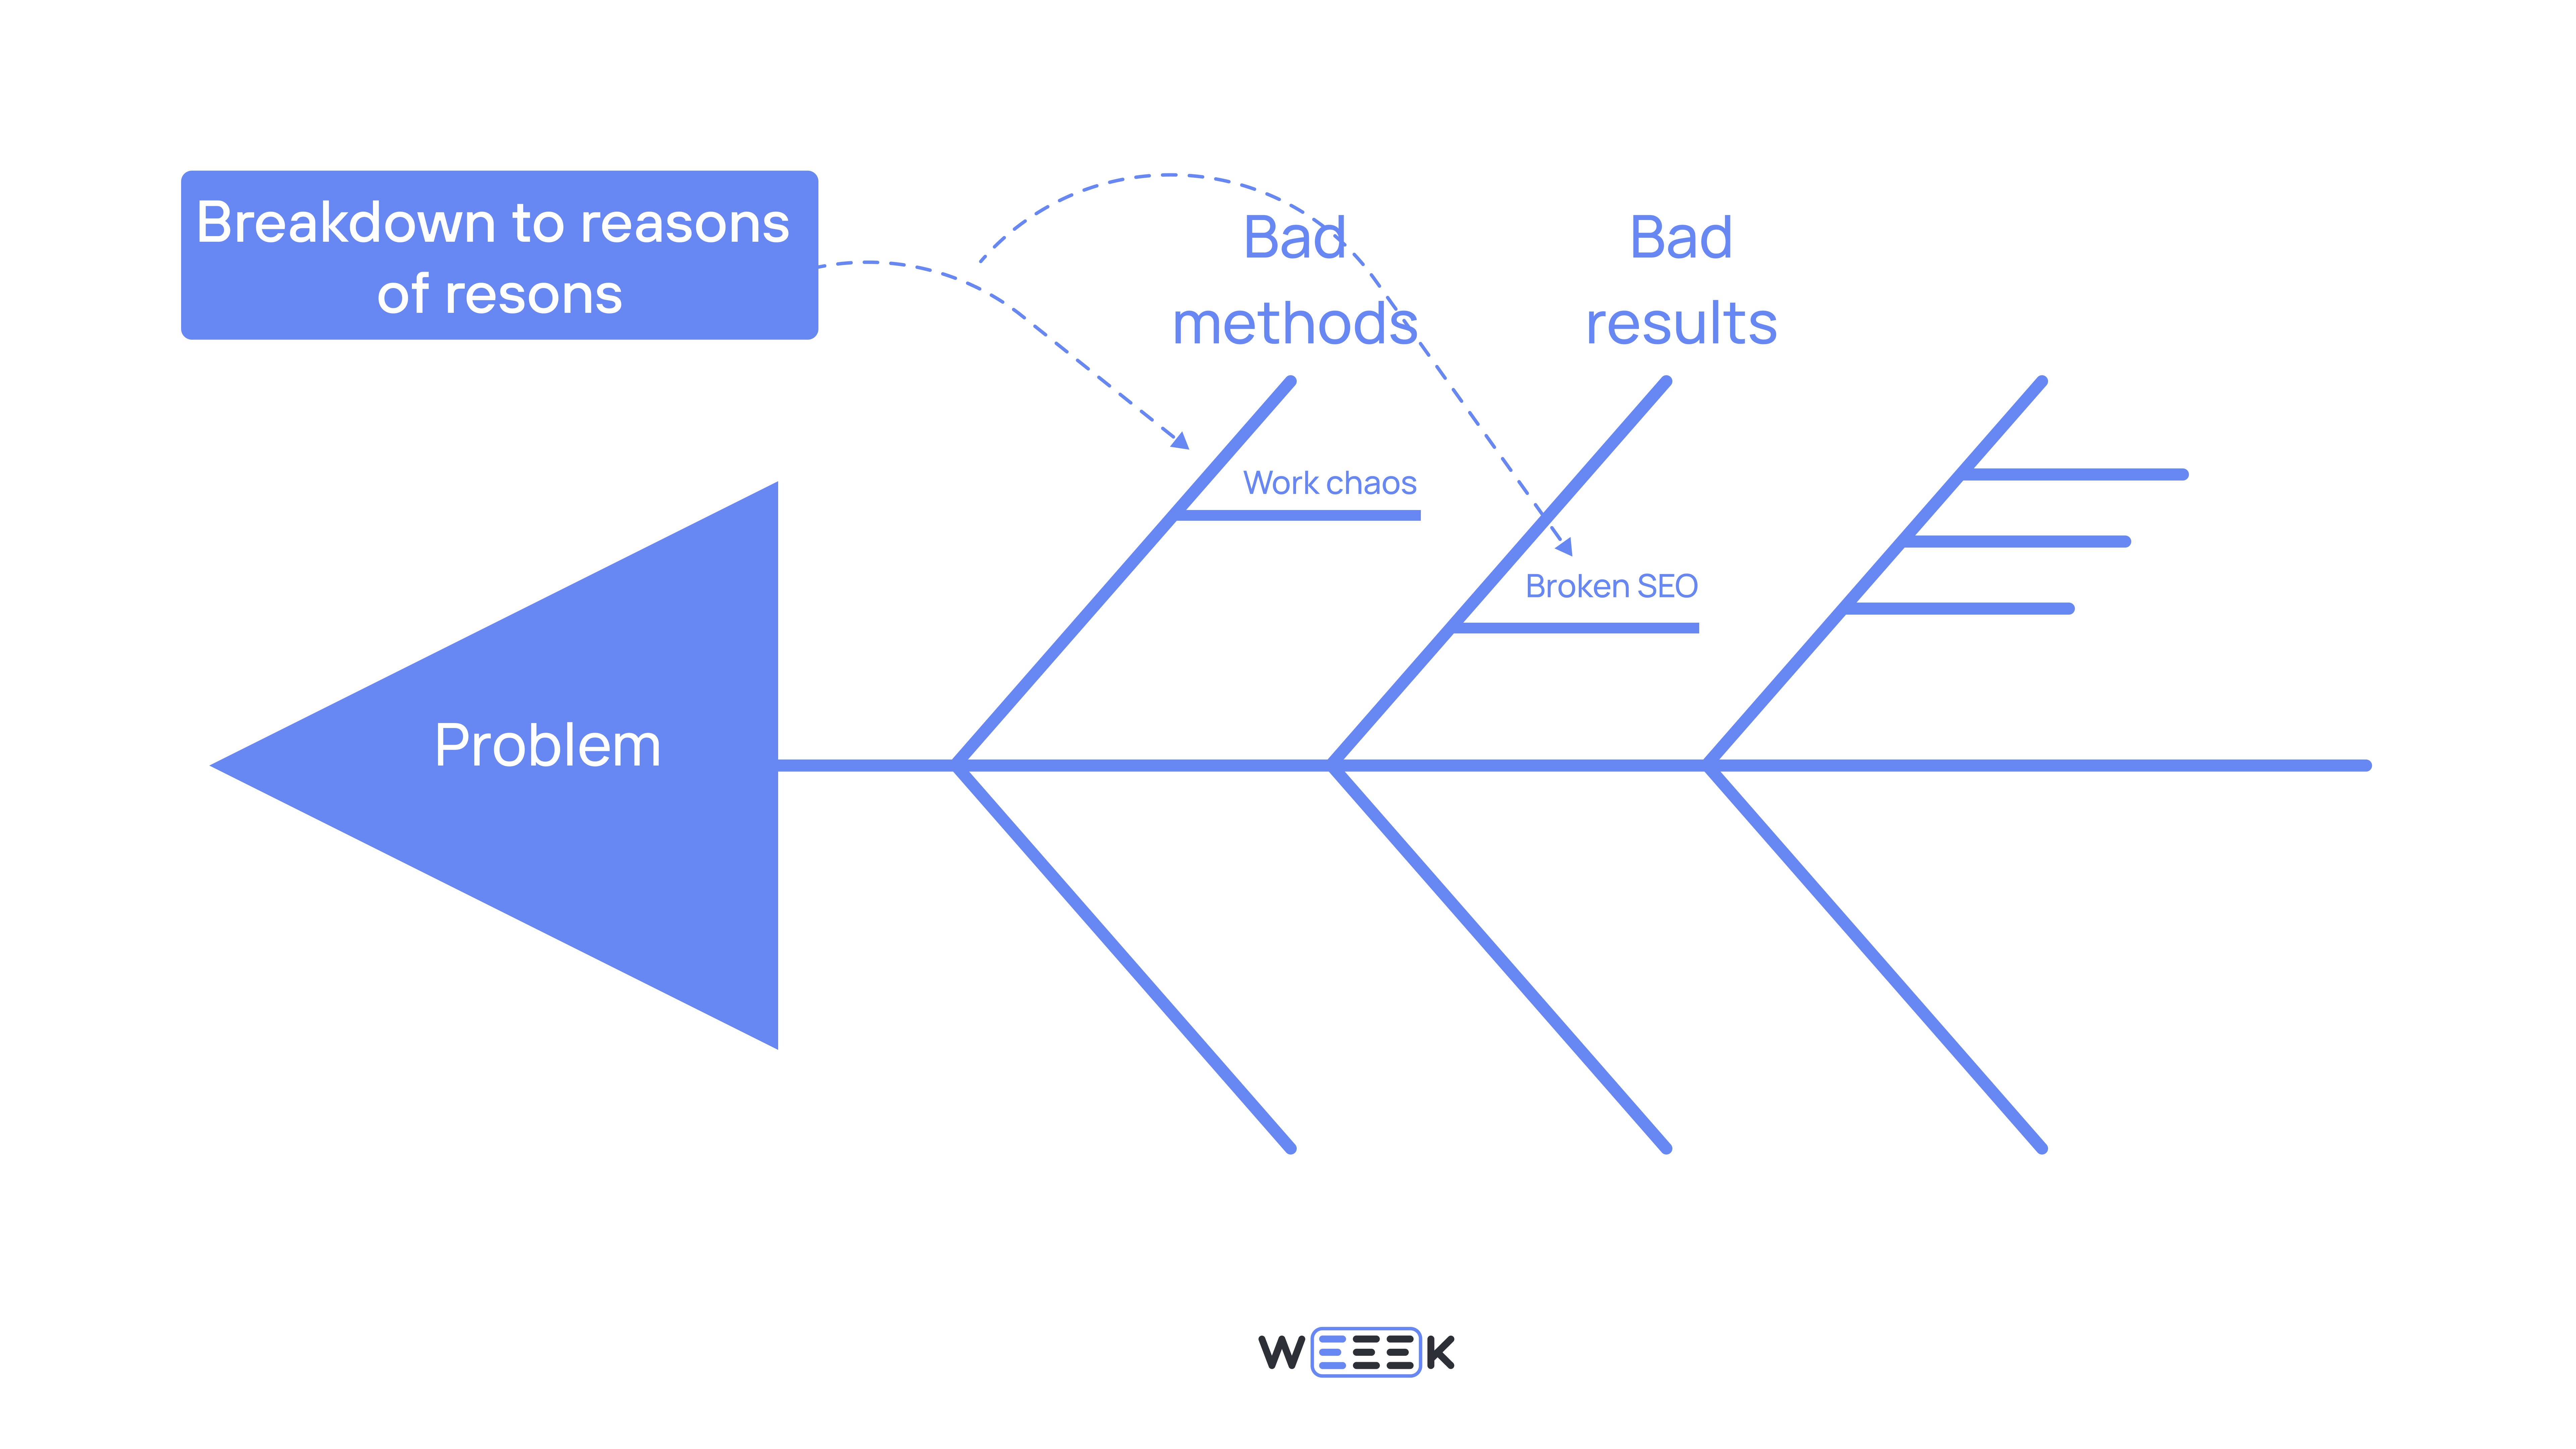
💡 It’s perfectly fine if some bones remain empty while others are crowded. The key is to uncover the most important causes and break them down to fully understand why they happened.
Step 4: Analyze the Diagram and Make Decisions
The Ishikawa Diagram is now complete! It’s time to review it as a team and develop a plan of action.
Possible decisions include:
- How can we ensure this issue doesn’t happen again?
- How can we optimize our current processes to resolve the situation and fix the problem?
💡 It’s highly recommended to record the problem analyzed in the diagram, along with the solutions and lessons learned, as part of your project documentation in any format you prefer. This forms the foundation of effective project risk management.
Methods for Building an Ishikawa Diagram
You now know how to build a diagram, but how do you dig into the root causes and then find the causes of those causes? To help you ask the right questions, consider using one of these methods. They are all great for brainstorming sessions.
The Five Whys Method
Originally used by Toyota to create Ishikawa Diagrams, this method involves asking five "Why?" questions about a specific problem. This sequence of questions helps uncover deeper insights into the issue.
For example:
- Why are car sales declining? The advertising isn't working.
- Why isn't the advertising working? Competitors are attracting the traffic.
- Why are competitors ahead? Their content is more engaging.
- Why is their content more engaging? They just launched a new model.
- Why did they launch a new model? They optimized the old one with features that attract their audience.
Each question guides the investigation and helps uncover the true causes of the problem.
👉🏻 If the competitors' success were due to better marketing, the issue would lie with the marketing or PR department. In this case, though, it's about competing with their new model, so you'll need data on production, finances, and the company’s strategic plan to build the diagram.
The Six Thinking Hats Method
In this method, each participant embodies one of six different thinking styles: strategic, analytical, creative, emotional-intuitive, positive, or critical. Each person "wears a hat" that represents a particular mode of thinking and asks relevant questions based on that style.
6M Element Analysis
This method involves looking for causes within six key areas, known as the 6 Ms: Method, Material, Man, Milieu, Machine, and Measurement. These translate to: methods, materials, people, environment, tools, and metrics.
Data is gathered from these areas and organized into the "fishbone" diagram.
While this method was originally used in manufacturing, you can adapt it to fit your business context by altering the categories. For instance, you could replace "Machine" with "Marketing" to move away from a production focus entirely.
Example of an Ishikawa Diagram for a Project
Since we’re stepping away from the traditional use of this diagram in manufacturing, let’s explore how to apply it to a digital business, specifically addressing the challenges of a digital agency.
Problem and Fish Head
Low user ratings on App Store and Google Play.
Main Cause Categories and Large Bones
- People — developers, designers, testers
- Processes — development, testing, launch, support
- Technologies — platforms (iOS, Android), frameworks, tools
- Users — expectations, needs, user experience
- External Factors — competition, market trends, changes in operating systems
- Metrics — product metrics, traffic metrics, overall product economics
These categories are well-suited for a 6M analysis, as they represent key areas of the business where the root causes of the problem likely reside.
Detailing Causes and Smaller Bones
We’ll need to explore each category in detail:
- People — What issues could arise here? Lack of experience or skills, poor communication, or perhaps an understaffed team.
- Processes — What problems could exist? Inadequate testing of features, a lengthy development cycle, or an app that’s become outdated and incompatible with current phone operating systems.
- Technologies — What’s the issue here? App instability, slow load times, or compatibility problems with various devices.
- Users — What challenges do users face? A non-intuitive interface, missing essential features, or an overload of unnecessary ones.
- External Factors — What’s affecting the app's performance? Strong competition, shifting user preferences, or platform limitations.
- Metrics — What’s wrong with our metrics? Poor traffic, weak marketing efforts, or a mismatch between product economics. Low conversion rates or poor user retention could also be contributing factors.
The structure would look something like this:
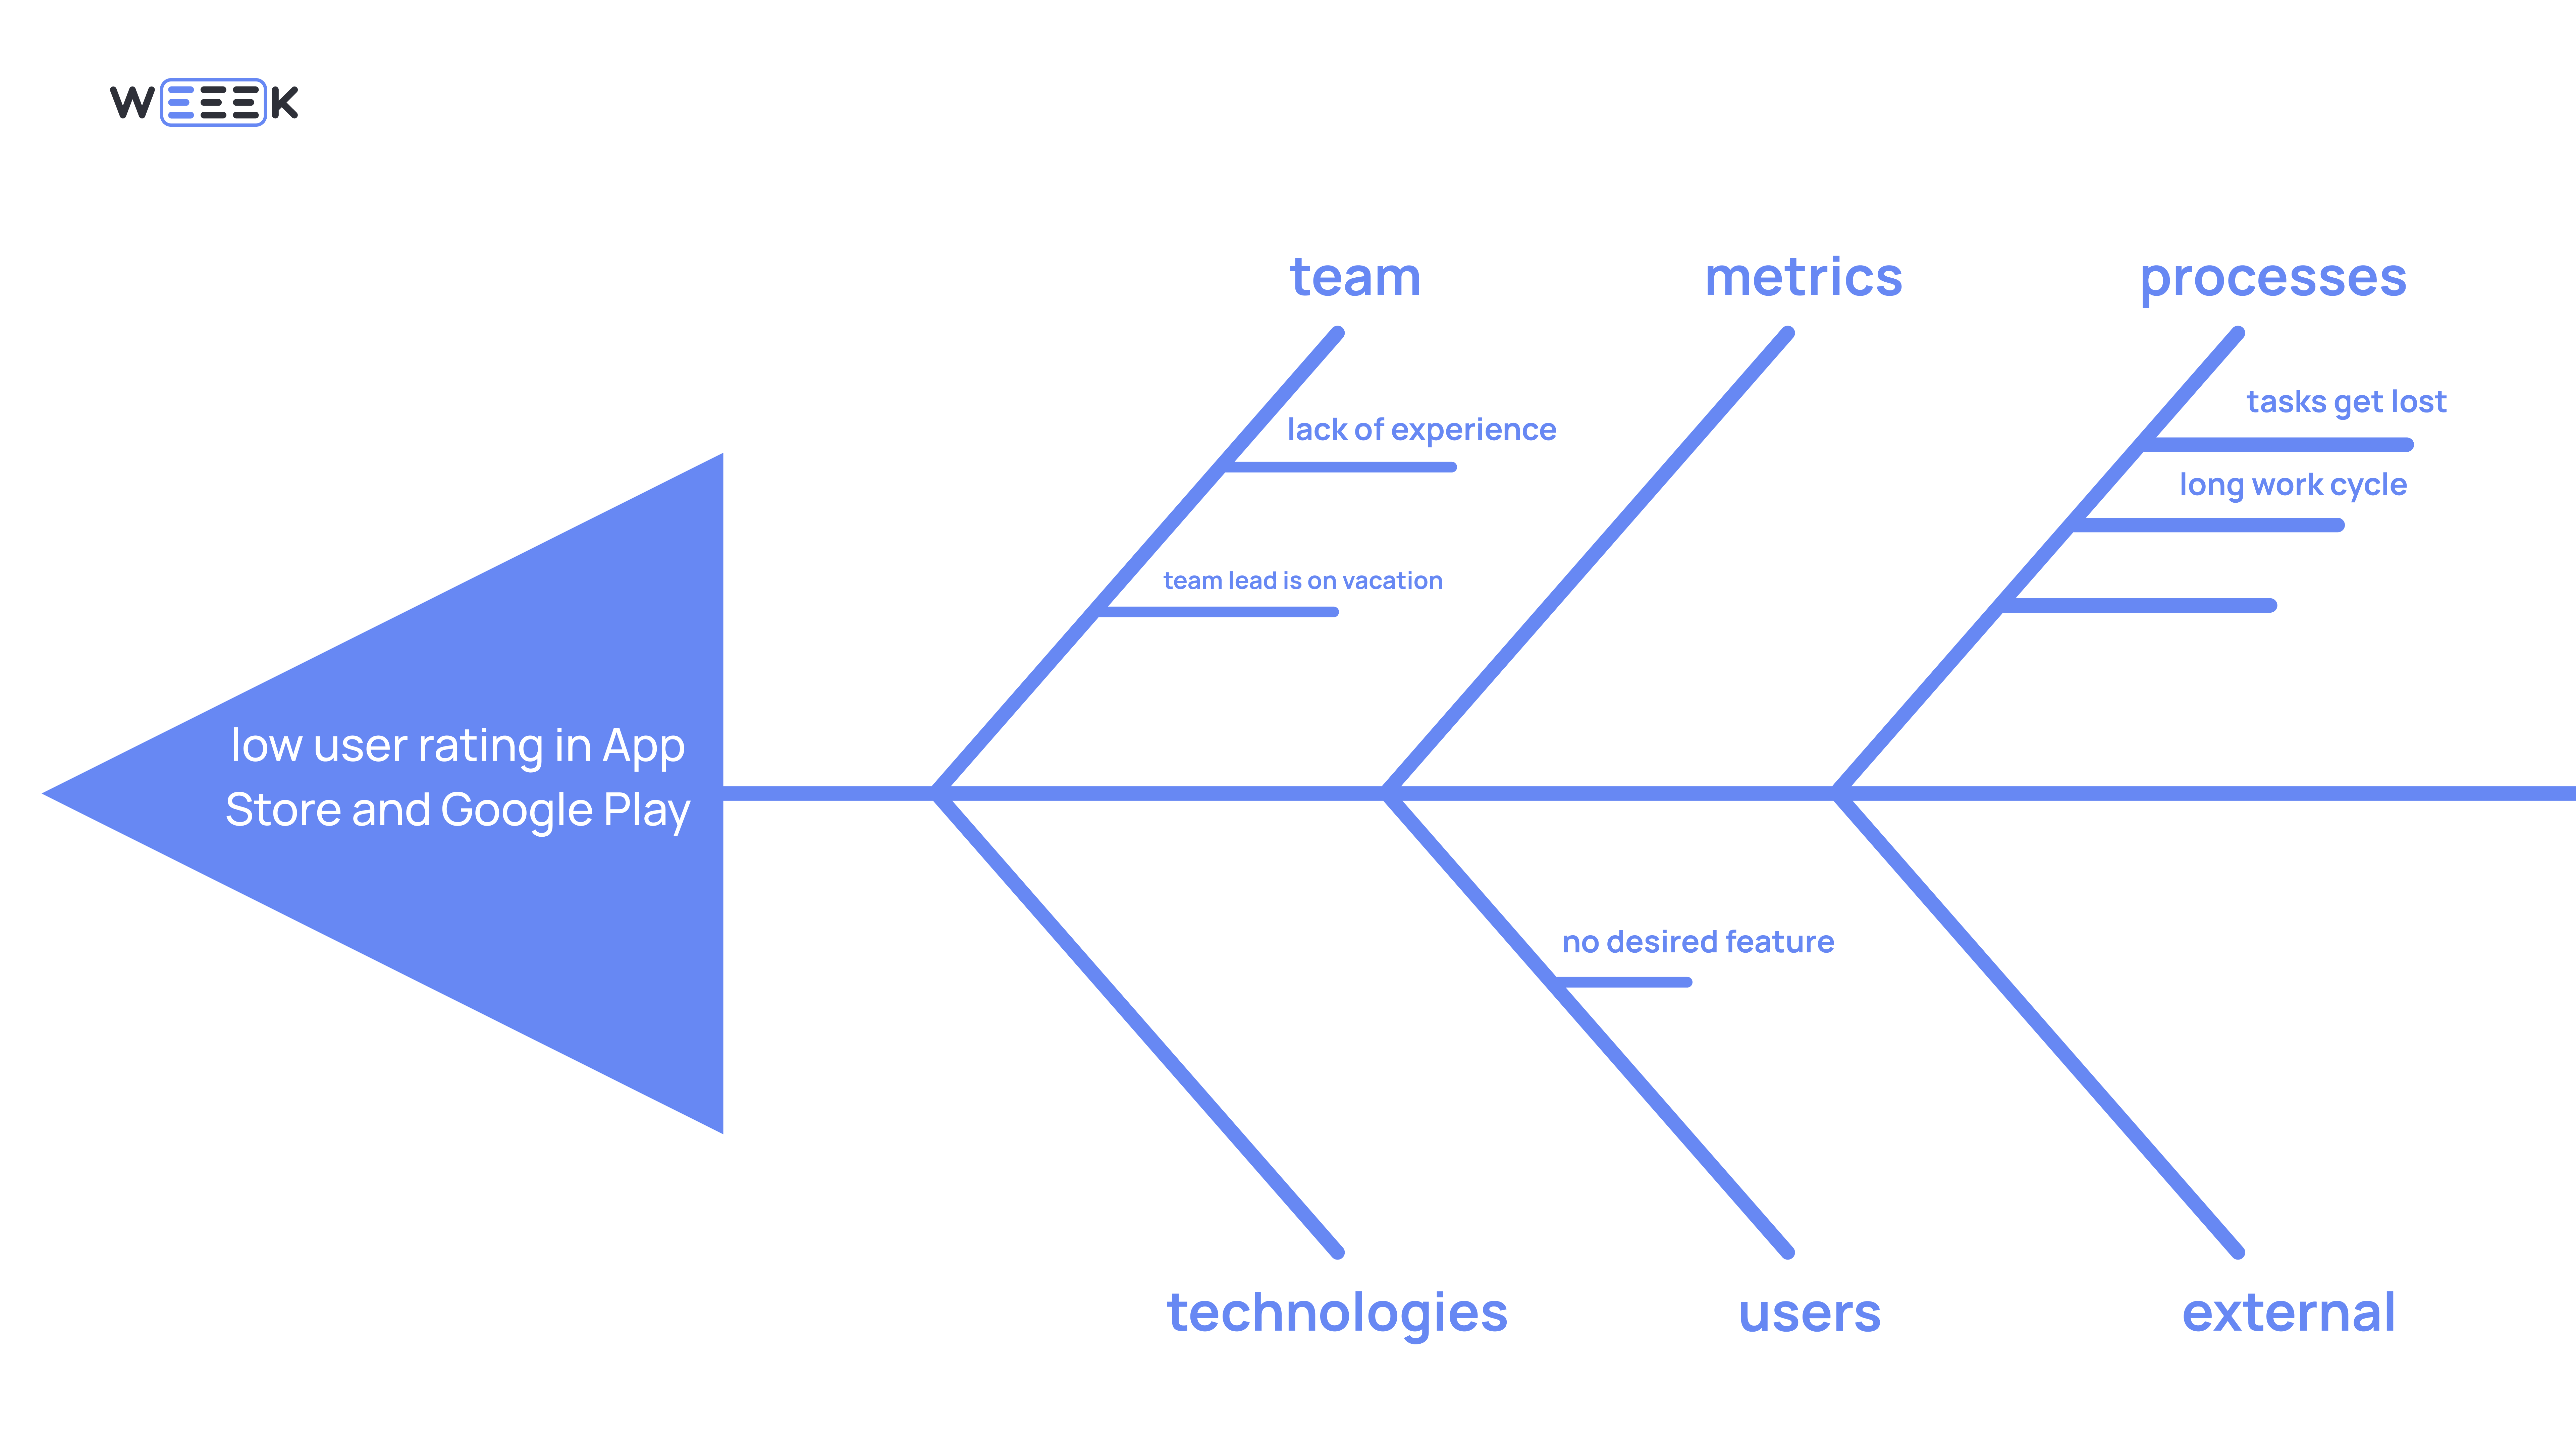
Each bone should be explored in greater depth by asking “why” for every identified issue. This is where methods like the Five Whys and Six Thinking Hats come in handy, as they help drill down to the true root causes of the problems.
Where to Build an Ishikawa Diagram
Miro
Miro is an excellent platform for visualizations. Here you can either create your own fishbone diagram or use a template, such as the one by NEXT LEVEL Partners, which was designed by Ryūji Fukuda based on the CEDAC system (Cause and Effect Diagram with the Addition of Cards).
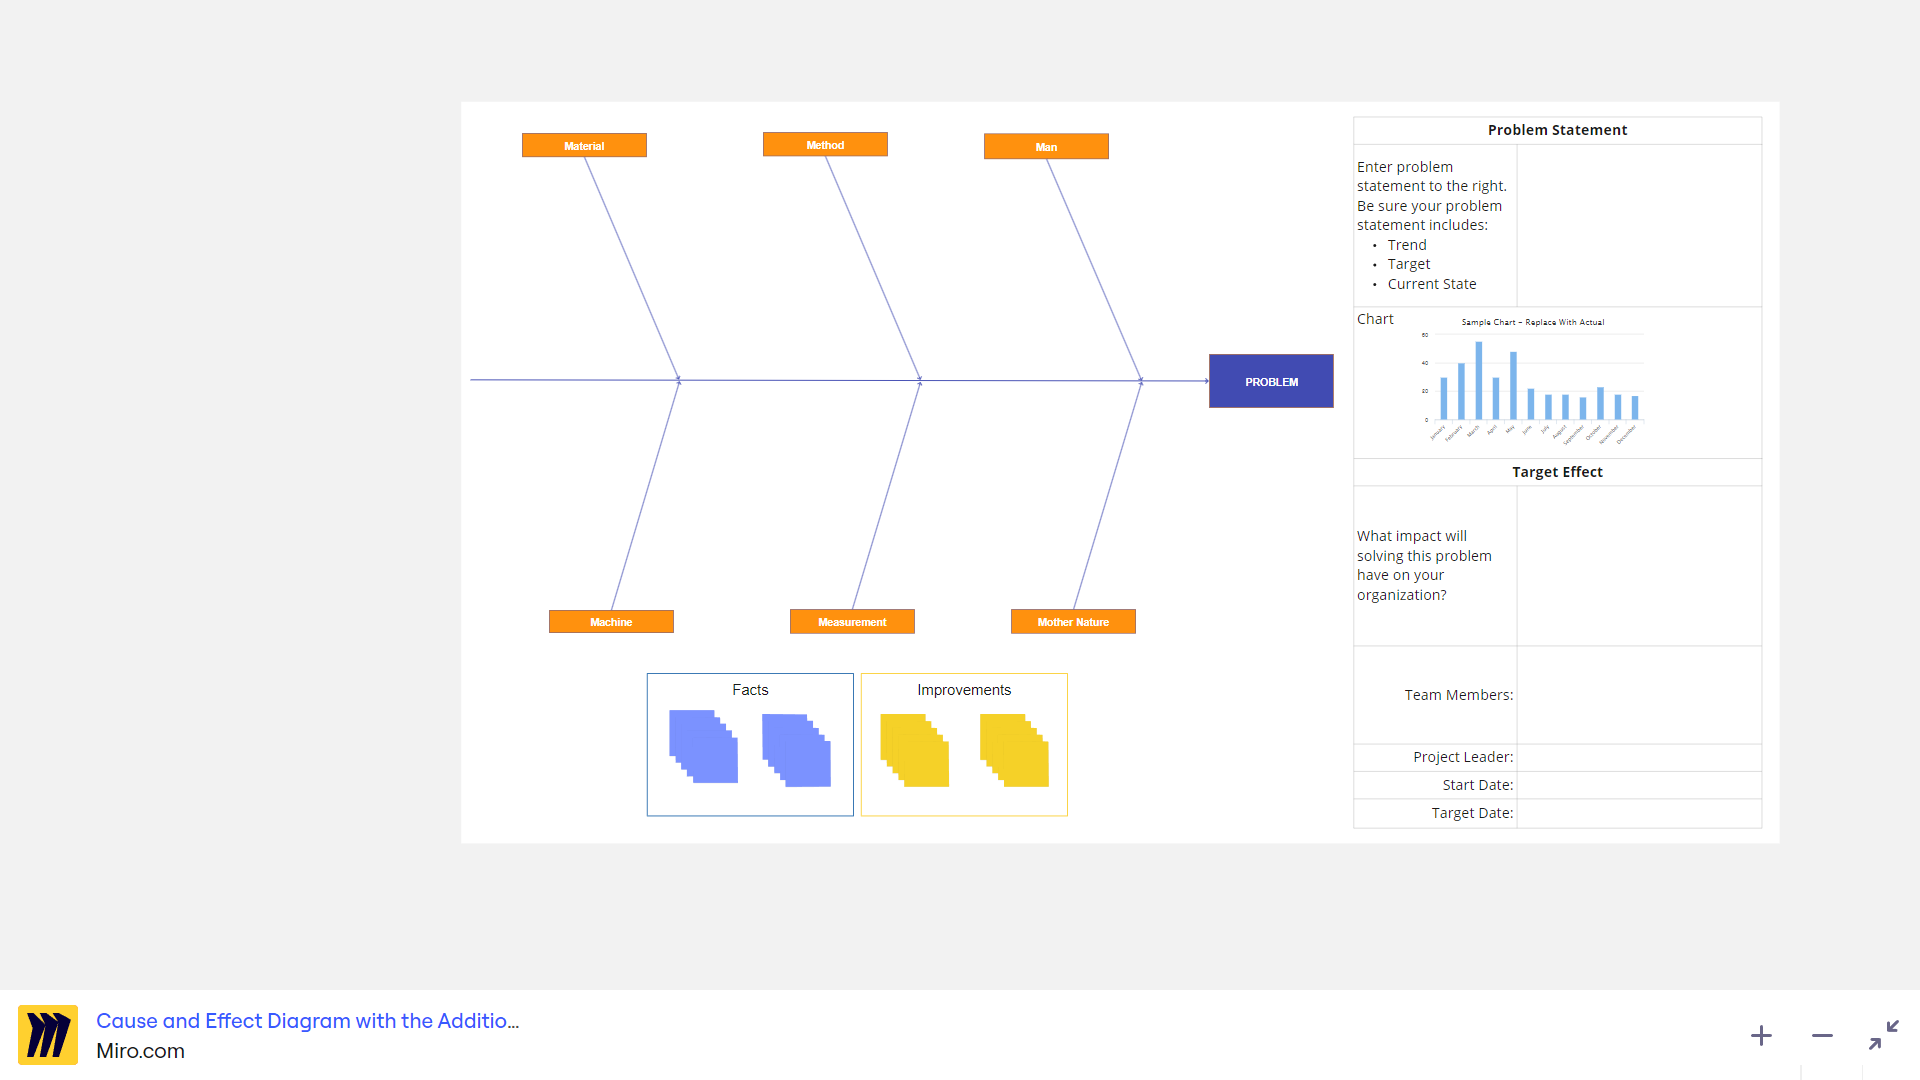
This system allows you to display both causes and solutions by using color-coded cards.
Figma and FigJam
These popular platforms for visualizations and diagrams also offer options for building Ishikawa diagrams.
Figma offers a free plan, with advanced features available through the Professional plan (up to $12/month) or the Organization plan (up to $45/month).
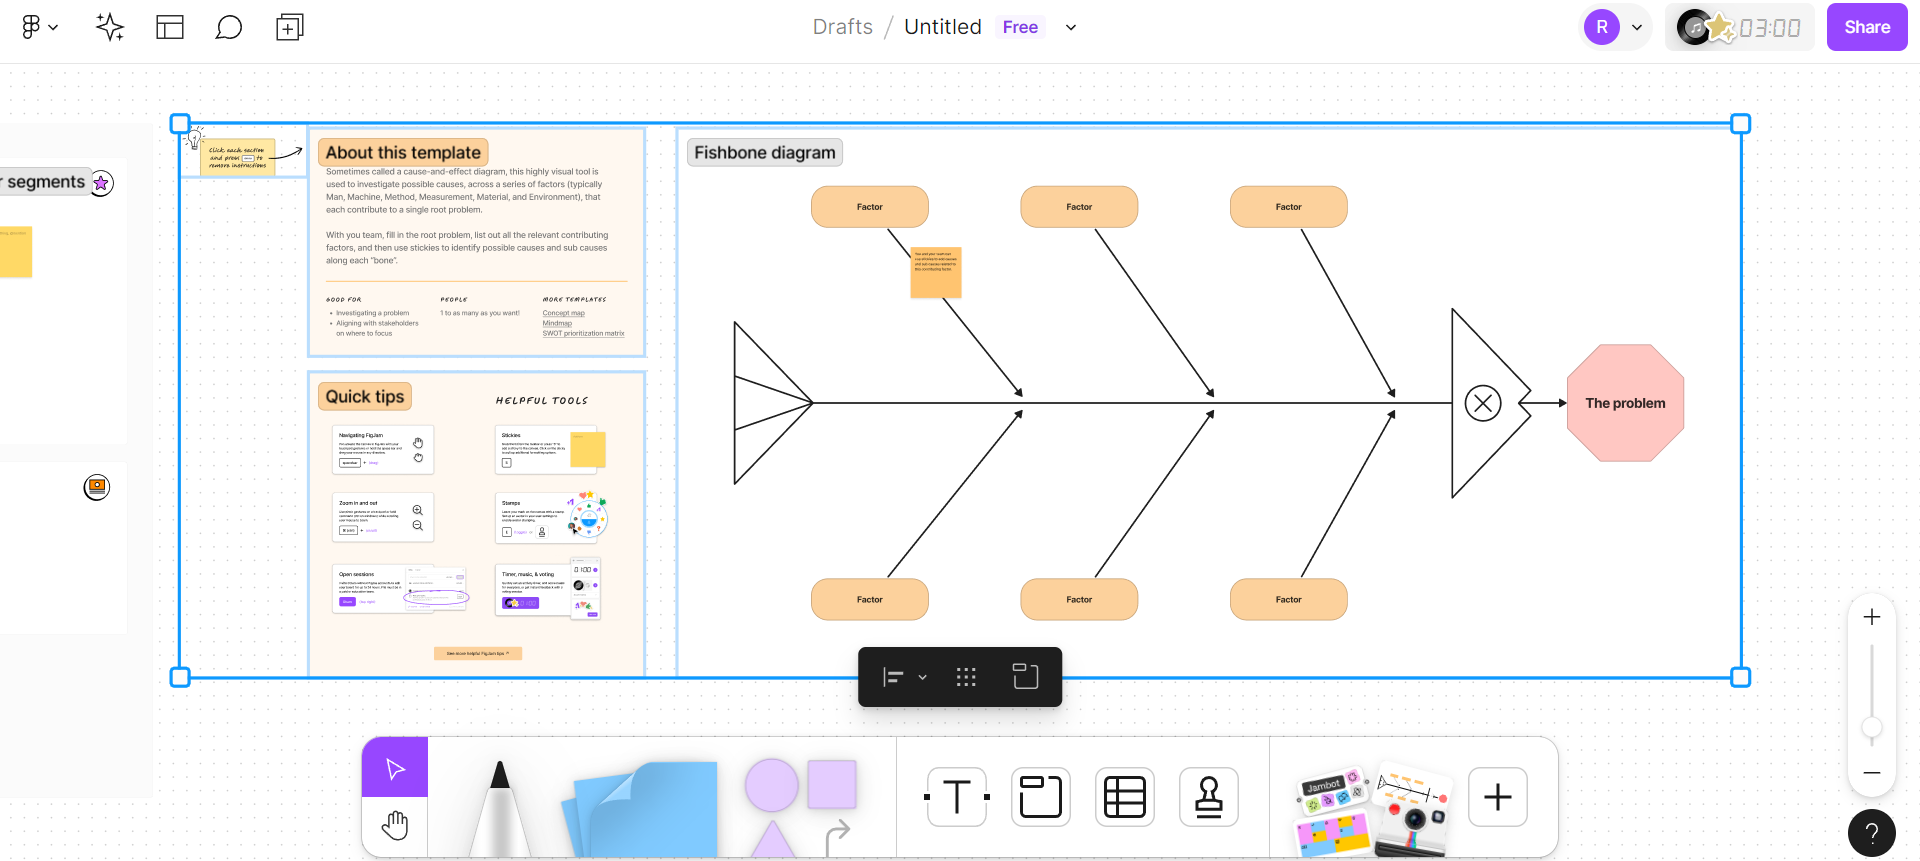
You can easily find a Fishbone Diagram template in Figma. One key advantage is that the template doesn’t restrict you to the traditional 6M categories, allowing you to customize it with factors that are relevant to your specific situation.
Lucidchart
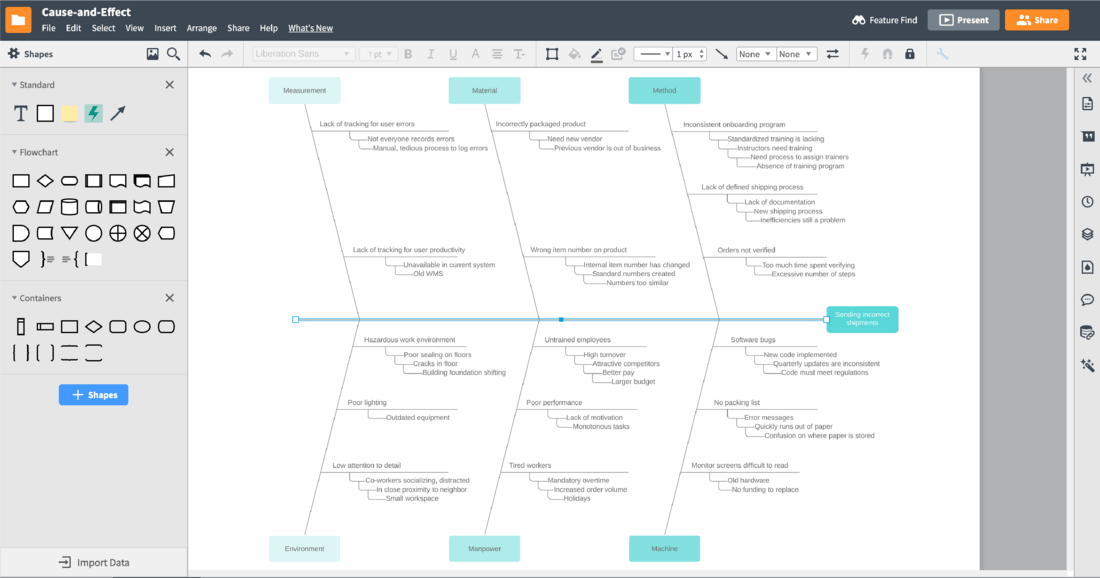
Lucidchart is a powerful tool for visualizing projects and processes, offering a wide range of infographic ideas. In addition to the free version, there are several pricing plans: individual ($9/month), team ($30/month), or enterprise ($36.50/month).
The Ishikawa Diagram is also available here! It's simple and includes special rows for detailing relationships and causes.
Canva
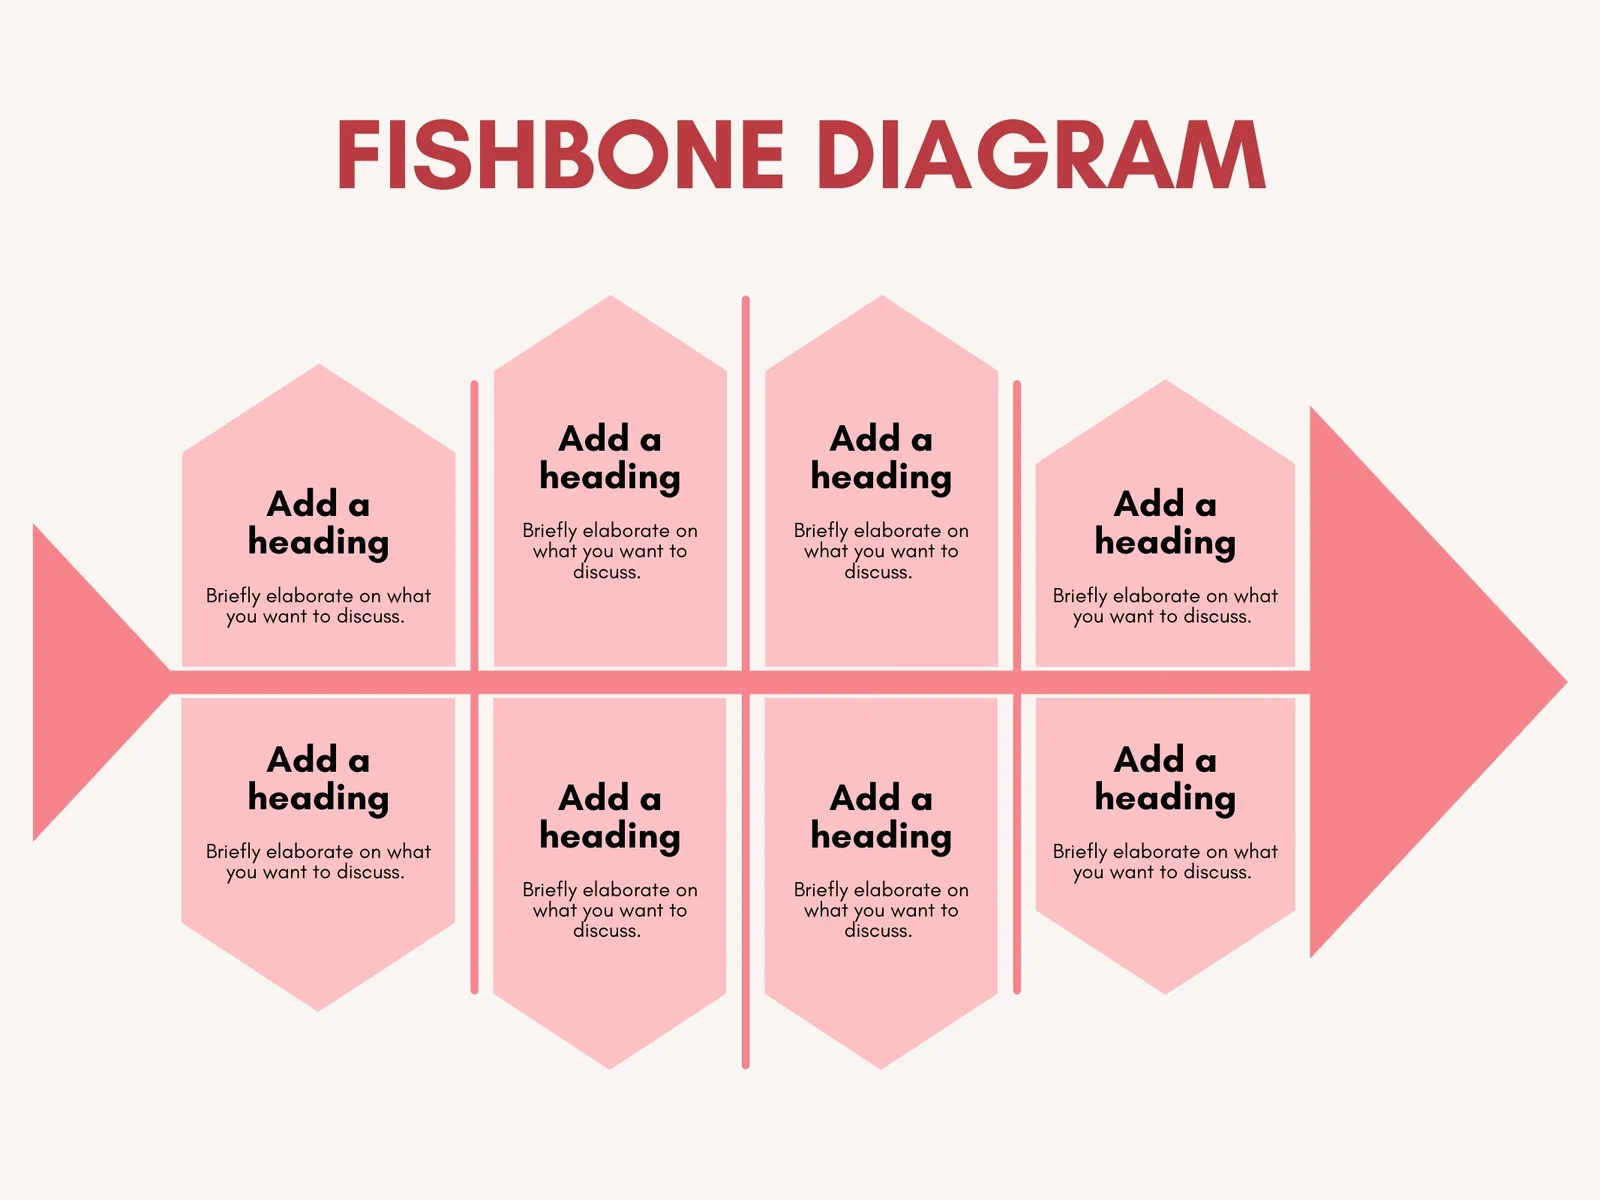
Canva is a graphic design platform that you can use individually for free or upgrade to the Pro plan for $12/month. You can also invite a team of three or more people and pay $10/month per user.
Canva offers a wide selection of templates, including several fishbone diagrams. You can easily find one that works for your project!
Conclusion Summary
📎 The Ishikawa Diagram, also called the fishbone or cause-and-effect diagram, is a powerful graphical tool for analyzing causes and assessing risks.
📎 It helps reveal hidden cause-and-effect relationships and enables you to develop effective strategies for problem-solving or process optimization.
📎 To build the diagram, break down processes into individual components, analyze each one in detail, and dive deep into the root causes of problems.
📎 Excellent platforms for creating fishbone diagrams include Miro, Lucidchart, Figma, and Canva—all of which offer dedicated templates for this purpose!


