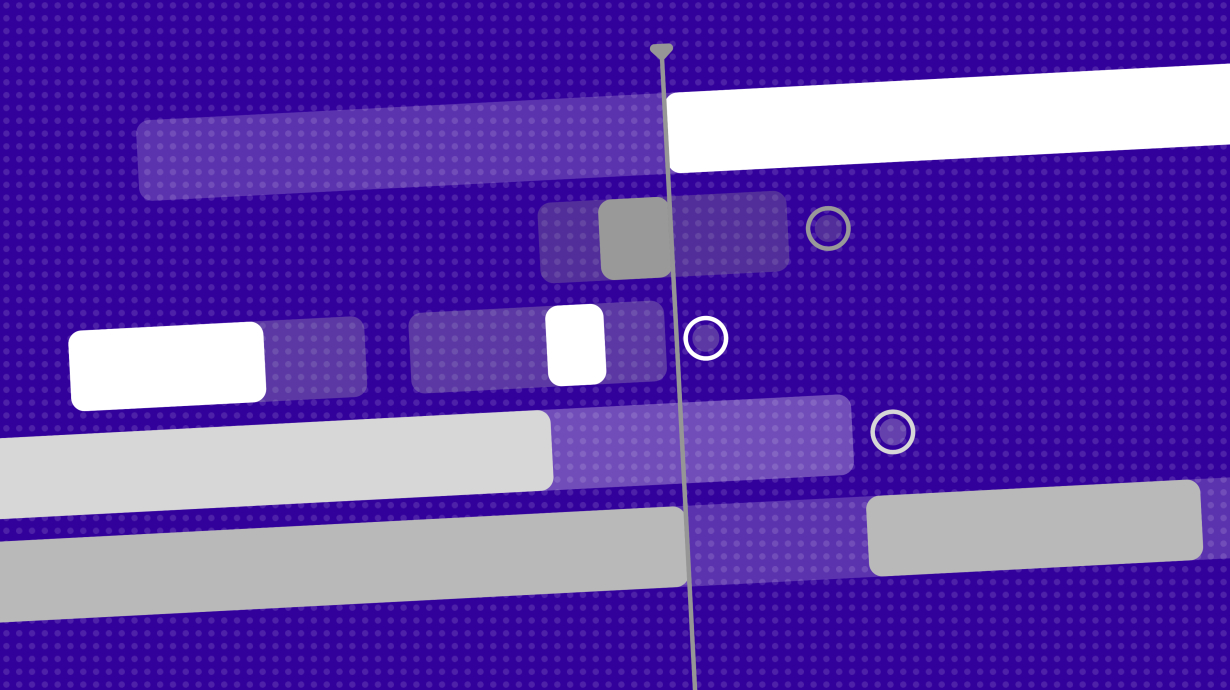
One of the main tasks of a project manager is to properly manage resources, especially time. In order to complete the project by the required deadline, the manager will need to link the tasks with the time. This is where the Gantt chart comes to the rescue - a bar chart on which tasks are located on the vertical axis, and on the horizontal axis - the time periods allocated for their implementation.
This is a great way to visually assess the work front, roughly estimate the duration, sequence, and dependence of tasks on each other. And... that's it?
Who invented the Gantt chart
If you say Gant, you'll be wrong and you won't be wrong at the same time.
It's like America and Columbus.
In 1896, Polish engineer Karol Adamiecki came up with the idea of visually displaying the progress of work on tasks on a horizontal bar chart (he called it a "harmonogram"). But he told about it in publications in Polish and Russian, so the idea did not spread.
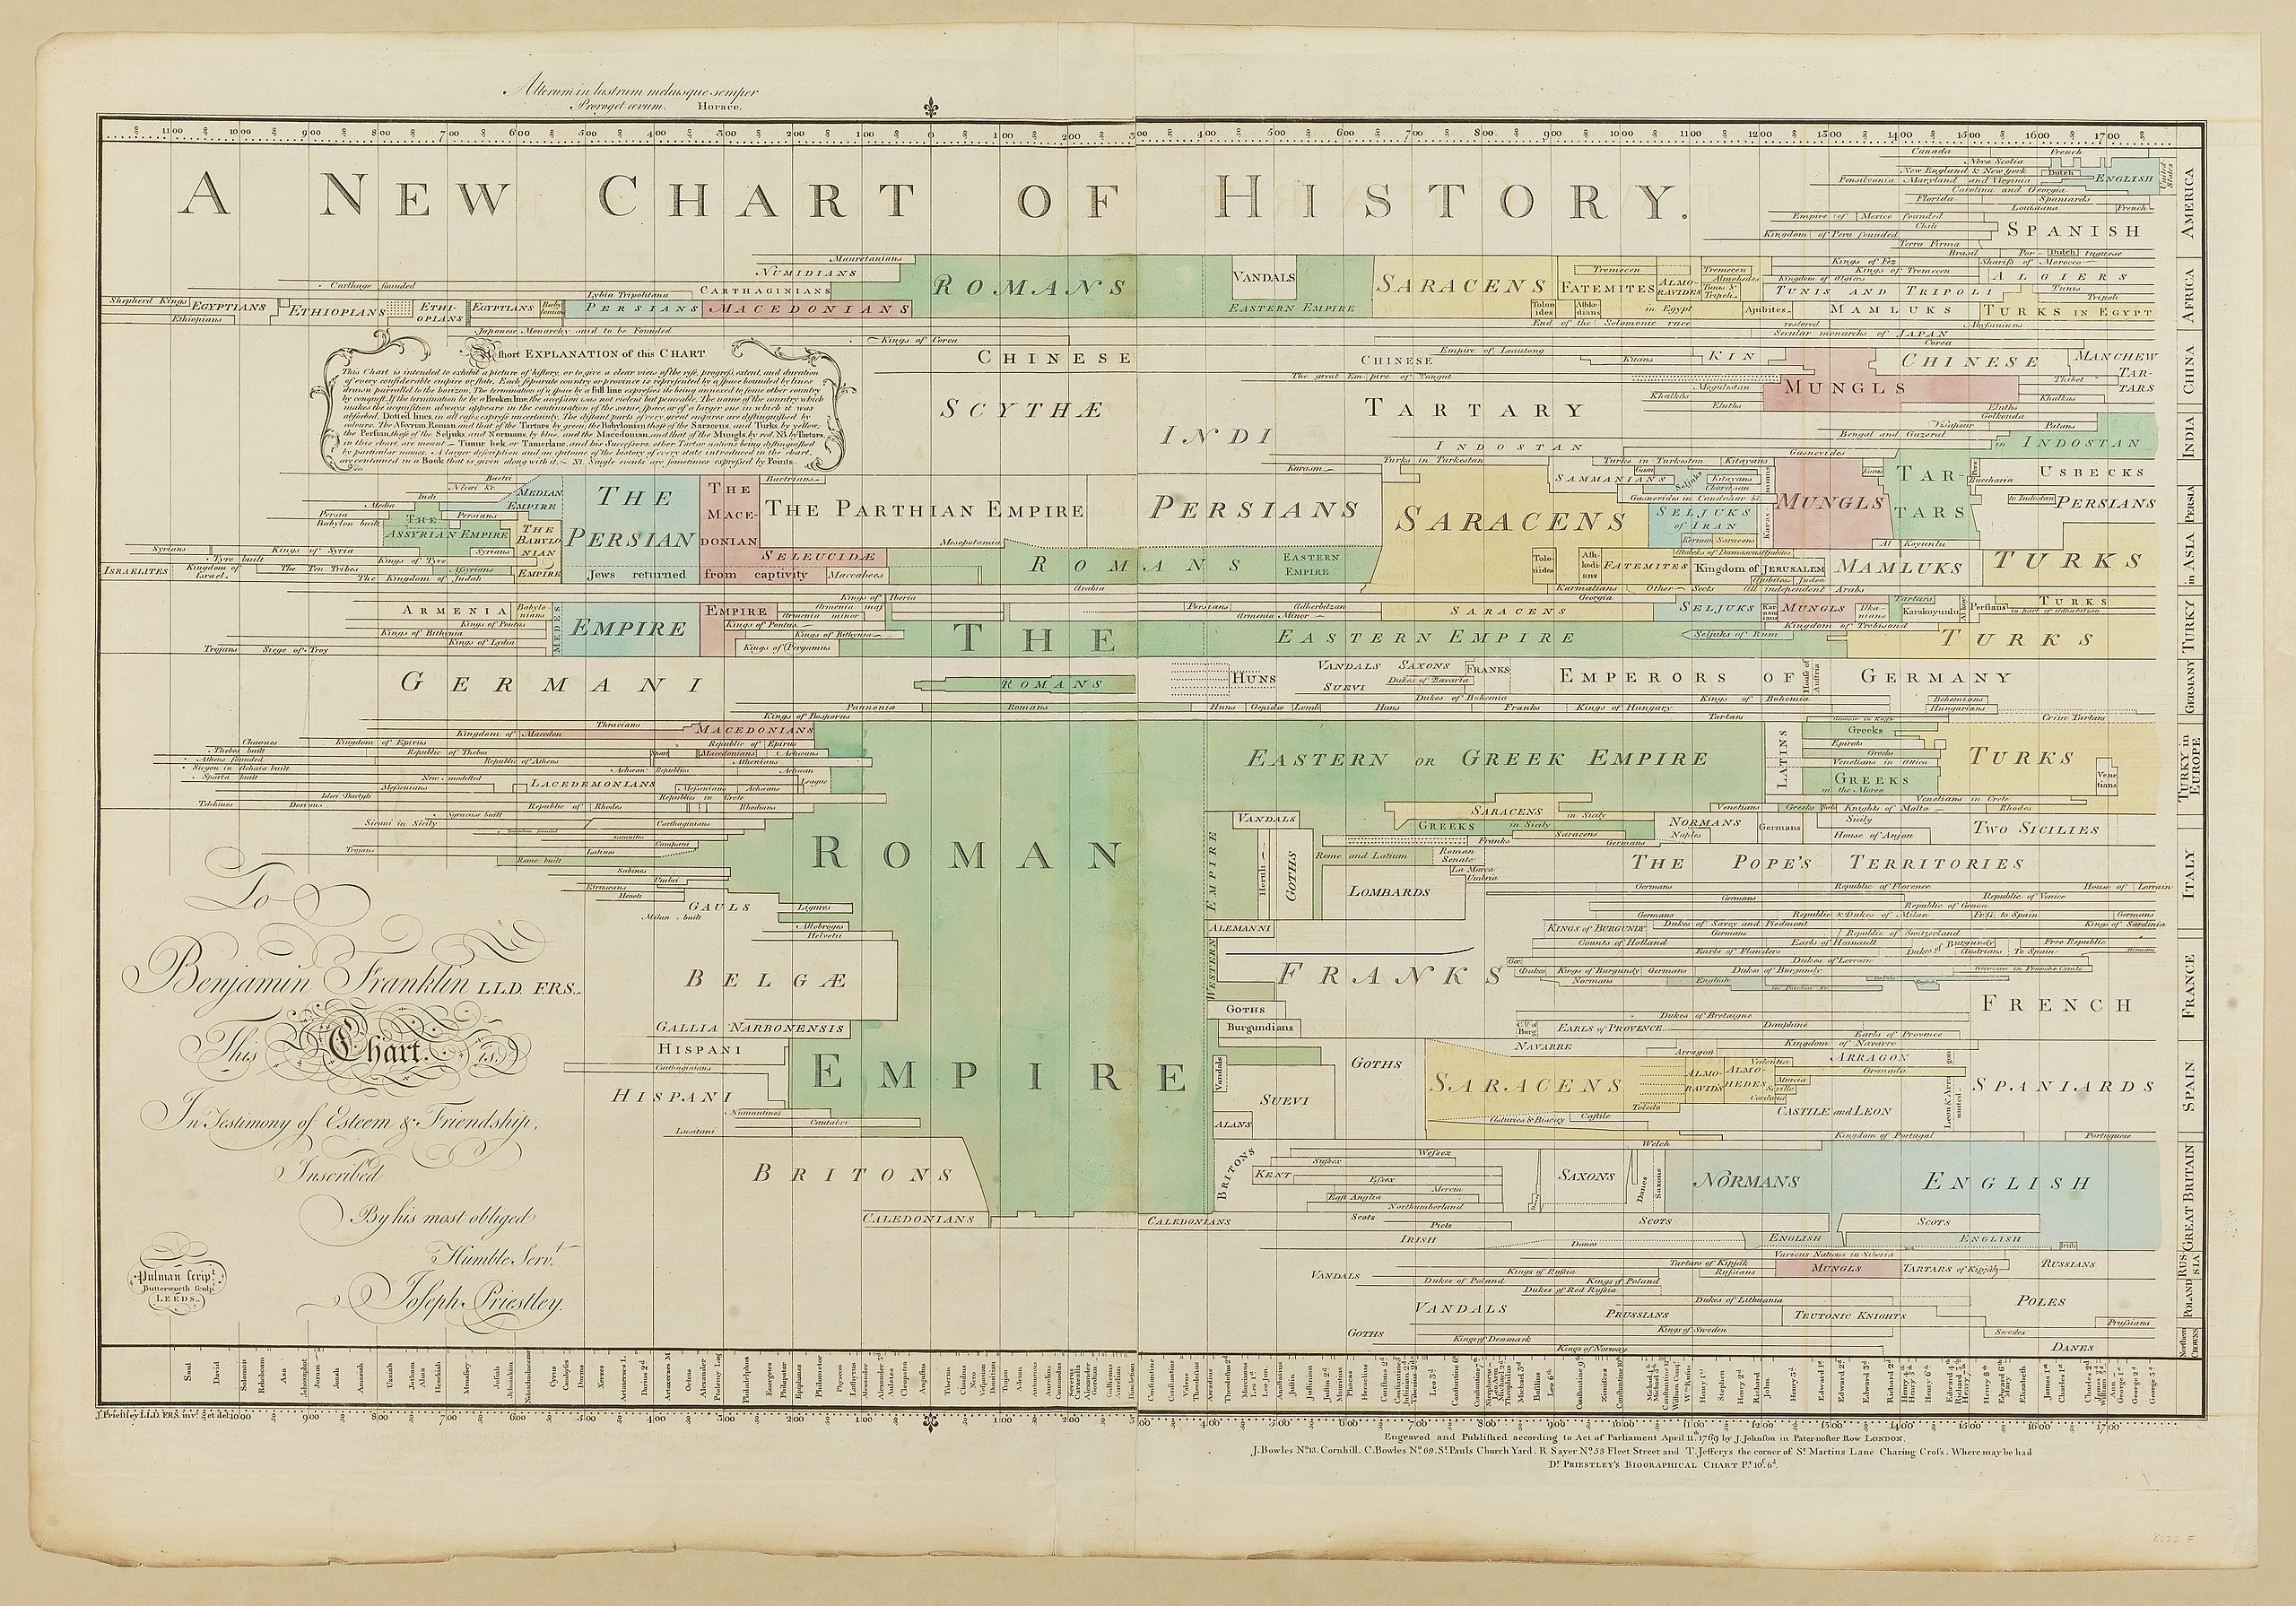
14 years later, independently of Adamiecki, the American engineer Henry L. Gantt came up with the same idea. Engaged in the production of ships during the First World War, he proposed a horizontal bar chart to control the performance of tasks in the project. Later, such a diagram will become one of the most popular ways to plan work (from the point of view of visualization, this is really a very cool method), well, they will call it by its name.
Who can use it?
And although the history of the Gantt chart begins at a time when there wasn't any computer technology, now it is more often used in IT projects. Although, it is suitable for planning any projects: from preparing a corporate party to building a spaceship. For example, the last time I used a Gantt chart was when I was planning a renovation in an apartment. This is very convenient.
What can be clearly seen on the Gantt chart:
- project start and end dates,
- project tasks,
- project team members,
- the performer of each task,
- the duration of each task,
- how the tasks are related or depend on each other.
Should I use a Gantt chart?
In words, the Gantt chart sounds like some kind of miracle - a way to plan project work and manage tasks. But in fact, it has both pros and cons. And the answer to the title question will be different, depending on what you expect from this diagram.
The Gantt chart, as I have already noted - is a very visual way of visualizing it. On it are visible:
- All tasks and deadlines - you can just see the scale of the project with your own eyes, right on the screen or on paper.
- Critical points - where many tasks go in parallel, they are done by the same people, which means, most likely, something can go wrong there.
- The order and relationship of tasks - sometimes several tasks must be done by the same person, sometimes to complete one task you first need to get the result in another -with the help of the Gantt chart, you will visually see all these connections and be able to plan everything correctly
- Project milestones - the points where two or more tasks are completed. There you can arrange a review of the work done and an interim summary of the results.
In addition, the Gantt chart is very easy to use — you can draw it on paper, make it in Google Tables (or Excel), or build it in some project management system.
But with all its advantages, in my opinion, the Gantt chart can not be used for project management. For planning purposes, yes. For management, no. Because it gives a false sense of security. You think you've drawn a diagram, planned everything out, and now the work will go like clockwork. But no. The fact is that any project is not static - it is a very dynamic thing, there is always something happening and going wrong. And the Gantt chart is a rigid framework on which you try to build a project. And at the slightest mistake - someone did not have time to draw the layout on time or the supplier sent defective components - the whole frame begins to collapse. One task shifts another, another shifts another, and so on, until a handful of dust remains from the plan.
In short, as I wrote at the very beginning, with the help of the Gantt chart, you can easily understand the amount of work, roughly estimate the duration (and therefore set deadlines more or less correctly), the dependence of tasks on each other. But you won't be able to follow the plan outlined by the Gantt chart.


