What is a SIPOC Diagram
A SIPOC diagram is a powerful tool for analyzing a company’s current processes. It provides a clear structure to describe a business process from start to finish. This tool is commonly used in quality improvement methodologies like Lean and Six Sigma.
The acronym SIPOC stands for:
- Suppliers. The sources or providers of the resources needed for the process.
- Inputs. The materials, data, and information required to perform the process.
- Process. A series of actions that transform the inputs into outputs.
- Outputs. The results, products, or services generated by the process.
- Customers. The end-users or recipients of the outputs—whether products or services.
By offering a comprehensive view of a process, the SIPOC diagram helps organizations identify critical elements, understand their interconnections, and discover opportunities for improvement.
The SIPOC diagram illustrates the flow of resources entering a company, the processes they undergo, and the recipients of the final product. It helps pinpoint specific issues within the process, such as delays in launching a new car model or releasing a feature update.
While primarily used for analyzing physical businesses like manufacturing, the SIPOC diagram can be adapted to effectively analyze digital business processes with minor adjustments.
🍪 SIPOC Diagram — Cookie Production Example
To illustrate how a SIPOC diagram works, let’s look at cookie production:
- Suppliers — Vendors providing flour, sugar, butter, eggs, and packaging materials
- Inputs — Ingredients (flour, sugar, butter, eggs), packaging materials, recipes, and production equipment
- Process — Mixing ingredients, baking, cooling, and packaging
- Outputs — Packaged cookies
- Customers — Satisfied wholesale and individual buyers
Why Use a SIPOC Diagram
🍪 SIPOC Diagram — Cookie Production Example
To illustrate how a SIPOC diagram works, let’s look at cookie production:
- Suppliers. Vendors providing flour, sugar, butter, eggs, and packaging materials.
- Inputs. Ingredients (flour, sugar, butter, eggs), packaging materials, recipes, and production equipment.
- Process. Mixing ingredients, baking, cooling, and packaging.
- Outputs. Packaged cookies.
- Customers. Satisfied wholesale and individual buyers.
Why Use a SIPOC Diagram
✔️ Gain a Holistic View of the Process. The SIPOC diagram helps you see the process from end to end, ensuring no aspect is overlooked. Problems are often attributed to internal processes while external factors go unnoticed. SIPOC provides a clear, comprehensive view.
✔️ Spot Bottlenecks. Are delays or errors occurring? SIPOC identifies exactly where issues arise within the process.
✔️ Boost Efficiency. Eliminating unnecessary steps is key to saving time and resources. SIPOC analysis makes these inefficiencies easy to spot.
✔️ Enhance Communication. With everyone viewing the same process map, collaboration improves. Team members clearly understand their roles and responsibilities, reducing miscommunication like, «I thought you were handling that!»
✔️ Standardize Processes. An optimized process becomes a reusable template for training new employees or applying in other departments. It replaces chaos with clarity and consistency.
Pros and Cons of a SIPOC Diagram
✅ Pros
- Focus on the Essentials. Breaks down complex business processes into logical stages, helping to maintain focus on key elements rather than getting bogged down by details.
- Improved Communication. Facilitates a shared understanding of the process across departments.
- Clarity and Accessibility. Makes it easy to explain the process to any team member.
- Versatility. Can be applied to various processes and business models.
❌ Cons
- High-Level Overview Only. Lacks the depth needed for more detailed analysis.
- No Immediate Solutions. Simply mapping the process doesn’t provide answers, additional time is needed to analyze the data.
- Limited for Complex Processes. For large or intricate workflows, multiple diagrams may be required, which can lead to confusion.
- Best for Stable Processes. Not ideal for rapidly changing processes, where a more adaptable tool would be more effective.
How to Describe Business Processes Using a SIPOC Diagram
To create a SIPOC diagram, collect information about the following components:
- Suppliers. Where the resources come from.
- Inputs. The resources entering the process, such as materials, data, or tools.
- Processes. The activities needed to transform inputs into outputs.
- Outputs. The products or services generated by the process.
- Customers. The recipients of the outputs, whether internal or external.
Where to Find This Information
While active involvement in a process may give the impression that you know it inside out, this confidence can often lead to oversights or ignoring valuable input from others involved.
To avoid these pitfalls:
- Include All Stakeholders. Engage everyone who directly participates in the process to gather a comprehensive perspective.
- Observe the Process. Watch the workflow in action to spot subtleties or overlooked steps.
- Ask Questions. Understand how suppliers, inputs, processes, outputs, and customers are interconnected.
- Document Everything. Ensure all key details are accurately captured in the diagram.
By following these steps, you can create a SIPOC diagram that is both precise and actionable, providing real value to your process analysis efforts.
Therefore:
Interview Key Participants
Engage individuals involved at different stages of the process — managers, operators, analysts, and sales staff. These stakeholders possess unique insights into specific steps, bottlenecks, and issues that may not be immediately visible.
❗ Be critical! Employees might not fully understand the entire process or even need to. They may also present the process more favorably than it is or exaggerate its challenges.
Analyze Documentation, Reports, and Task Manager Data
Review existing regulations, instructions, standards, and task completion reports. If these documents don’t exist, it may be worth creating them. They provide a formalized view of how the process should work. Compare the theoretical framework with practical operations to identify gaps.
If the company uses task management tools:
Examine projects or employee task boards, focusing on task statuses and key stages. Verify how up-to-date the tasks are and when the data was last updated.
❗ Double-check with managers and team leads to confirm accuracy. Outdated or irrelevant elements should not be included in the SIPOC diagram.
Observe the Process
If working with production processes, observe operations firsthand. Theory and employee accounts often differ significantly from reality.
Watching the process in action reveals every step and demonstrates how systems and people interact. It helps pinpoint real issues and confirms the actual outcomes.
❗ Conduct multiple observations to obtain a more objective perspective.
Involve the Team
Bring together key participants to collaboratively create the SIPOC diagram. A collective approach minimizes errors, as each participant adds their unique knowledge and expertise.
❗ Anticipate conflicting opinions! Participants may have differing interpretations of the process. You may need to revisit interviews or observations to resolve discrepancies and ensure the data is accurate.
This methodical approach ensures a reliable and actionable SIPOC diagram that reflects the true state of your processes.
How to Build a SIPOC Diagram in 6 Steps
Let’s use the example of landing page development to create a SIPOC diagram.
❗ Important: This example isn’t a one-size-fits-all template for every company creating landing pages. Business processes vary, so it’s essential to tailor the diagram to suit your specific workflow.
Step 1. Define What You’re Describing
Although the SIPOC diagram lists components in the order of Suppliers, Inputs, Process, Outputs, and Customers, you don’t need to follow this sequence when constructing it. Some start with outputs, while others prefer beginning with the process.
💡 Tip: Rearrange the components as needed—start with either outputs or the process, whichever is most intuitive. However, always focus on one specific area, such as a single business process or the creation of a single product.
Examples:
1️⃣ If you specialize in creating landing pages with a consistent structure, one diagram will cover your needs.
2️⃣ If you’re a digital agency offering diverse services (e.g., static landing pages, animated designs, or logic-heavy websites), you’ll need separate diagrams for each service since their inputs and suppliers differ.
For this example, we’re working with a simple case: creating static landing pages. This is our output, so we’ll start there.
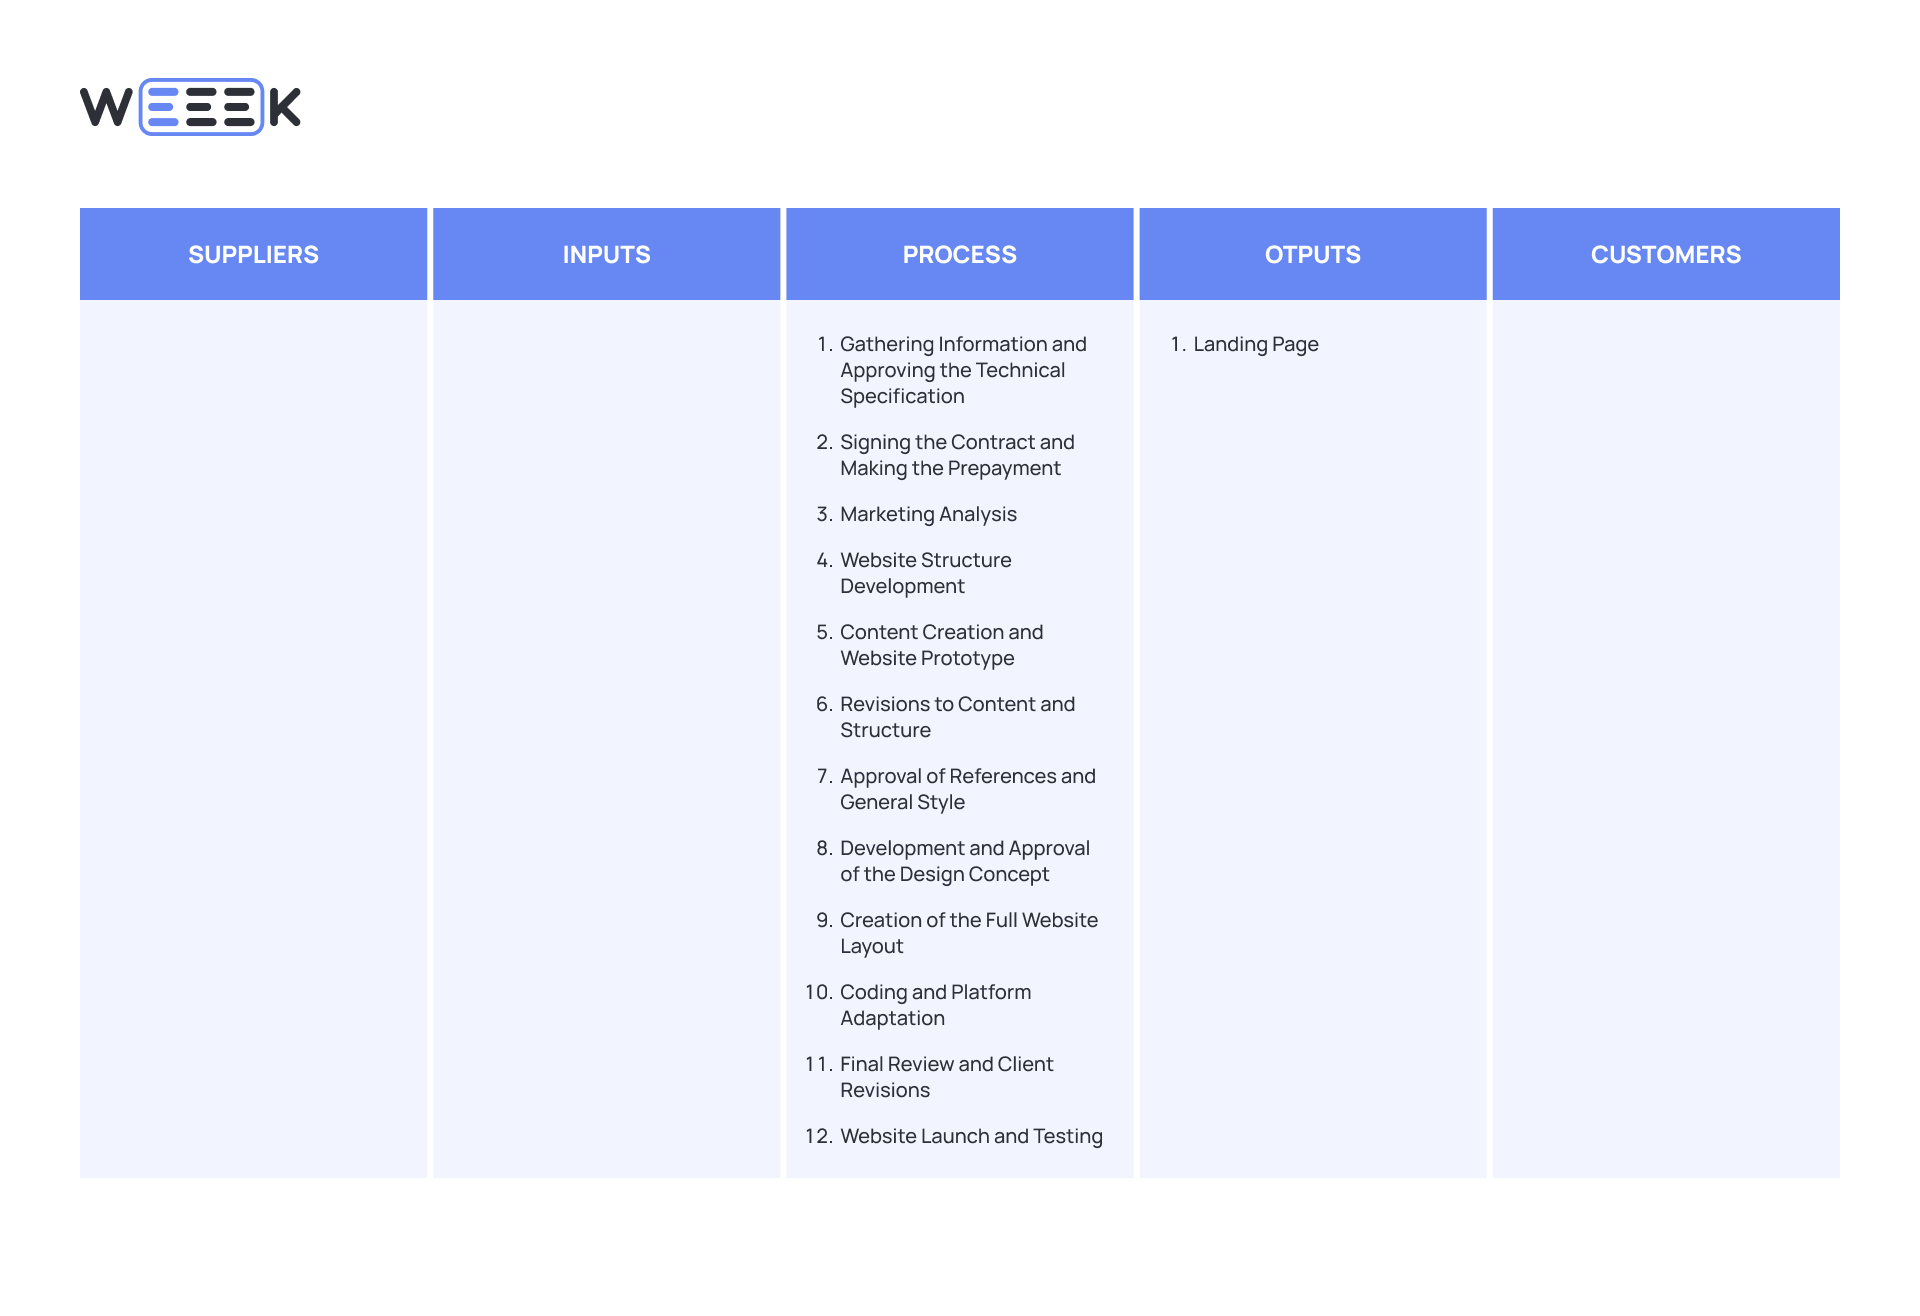
Step 2. Describe the Process
Divide the process into logical stages, ensuring that each step flows smoothly into the next.
Example: Landing Page Development
First Stage — Collect Information
✔️ Determine who needs the landing page, its purpose, who will use it, and analyze competitors.
In practice, this could mean 33 client calls, multiple follow-ups, and even over-the-top efforts to gain approval. On the diagram, however, simplify this to one concise step: «Information Gathering».
Questions About Processes
- Which stages of the process take the most time?
- Are there stages prone to frequent errors?
- Can any parts of the process be simplified or automated?
Common Mistakes
- Oversimplified Process Descriptions. Be specific and clearly define key stages to avoid overlooking critical details.
- Overly Detailed Process Descriptions. Aim for balance. If a process involves many repetitive steps, group them into a single stage to maintain clarity.
- Skipping Control Points. Include quality checks, tests, and reviews explicitly. These steps (or the lack of them) can significantly affect the outcome.
Step 3. Define or Refine the Output
Even if your SIPOC diagram begins with outputs, revisit and refine this section if needed. Outputs should be specific and measurable, representing tangible value for the client or the process stage, such as products, reports, or data.
Questions About Processes
- Which stages of the process take the most time?
- Are there stages prone to frequent errors?
- Can any parts of the process be simplified or automated?
Common Mistakes
- Oversimplified Process Descriptions. Be specific and clearly define key stages to avoid overlooking critical details.
- Overly Detailed Process Descriptions. Aim for balance. If a process involves many repetitive steps, group them into a single stage to maintain clarity.
- Skipping Control Points. Include quality checks, tests, and reviews explicitly. These steps (or the lack of them) can significantly affect the outcome.
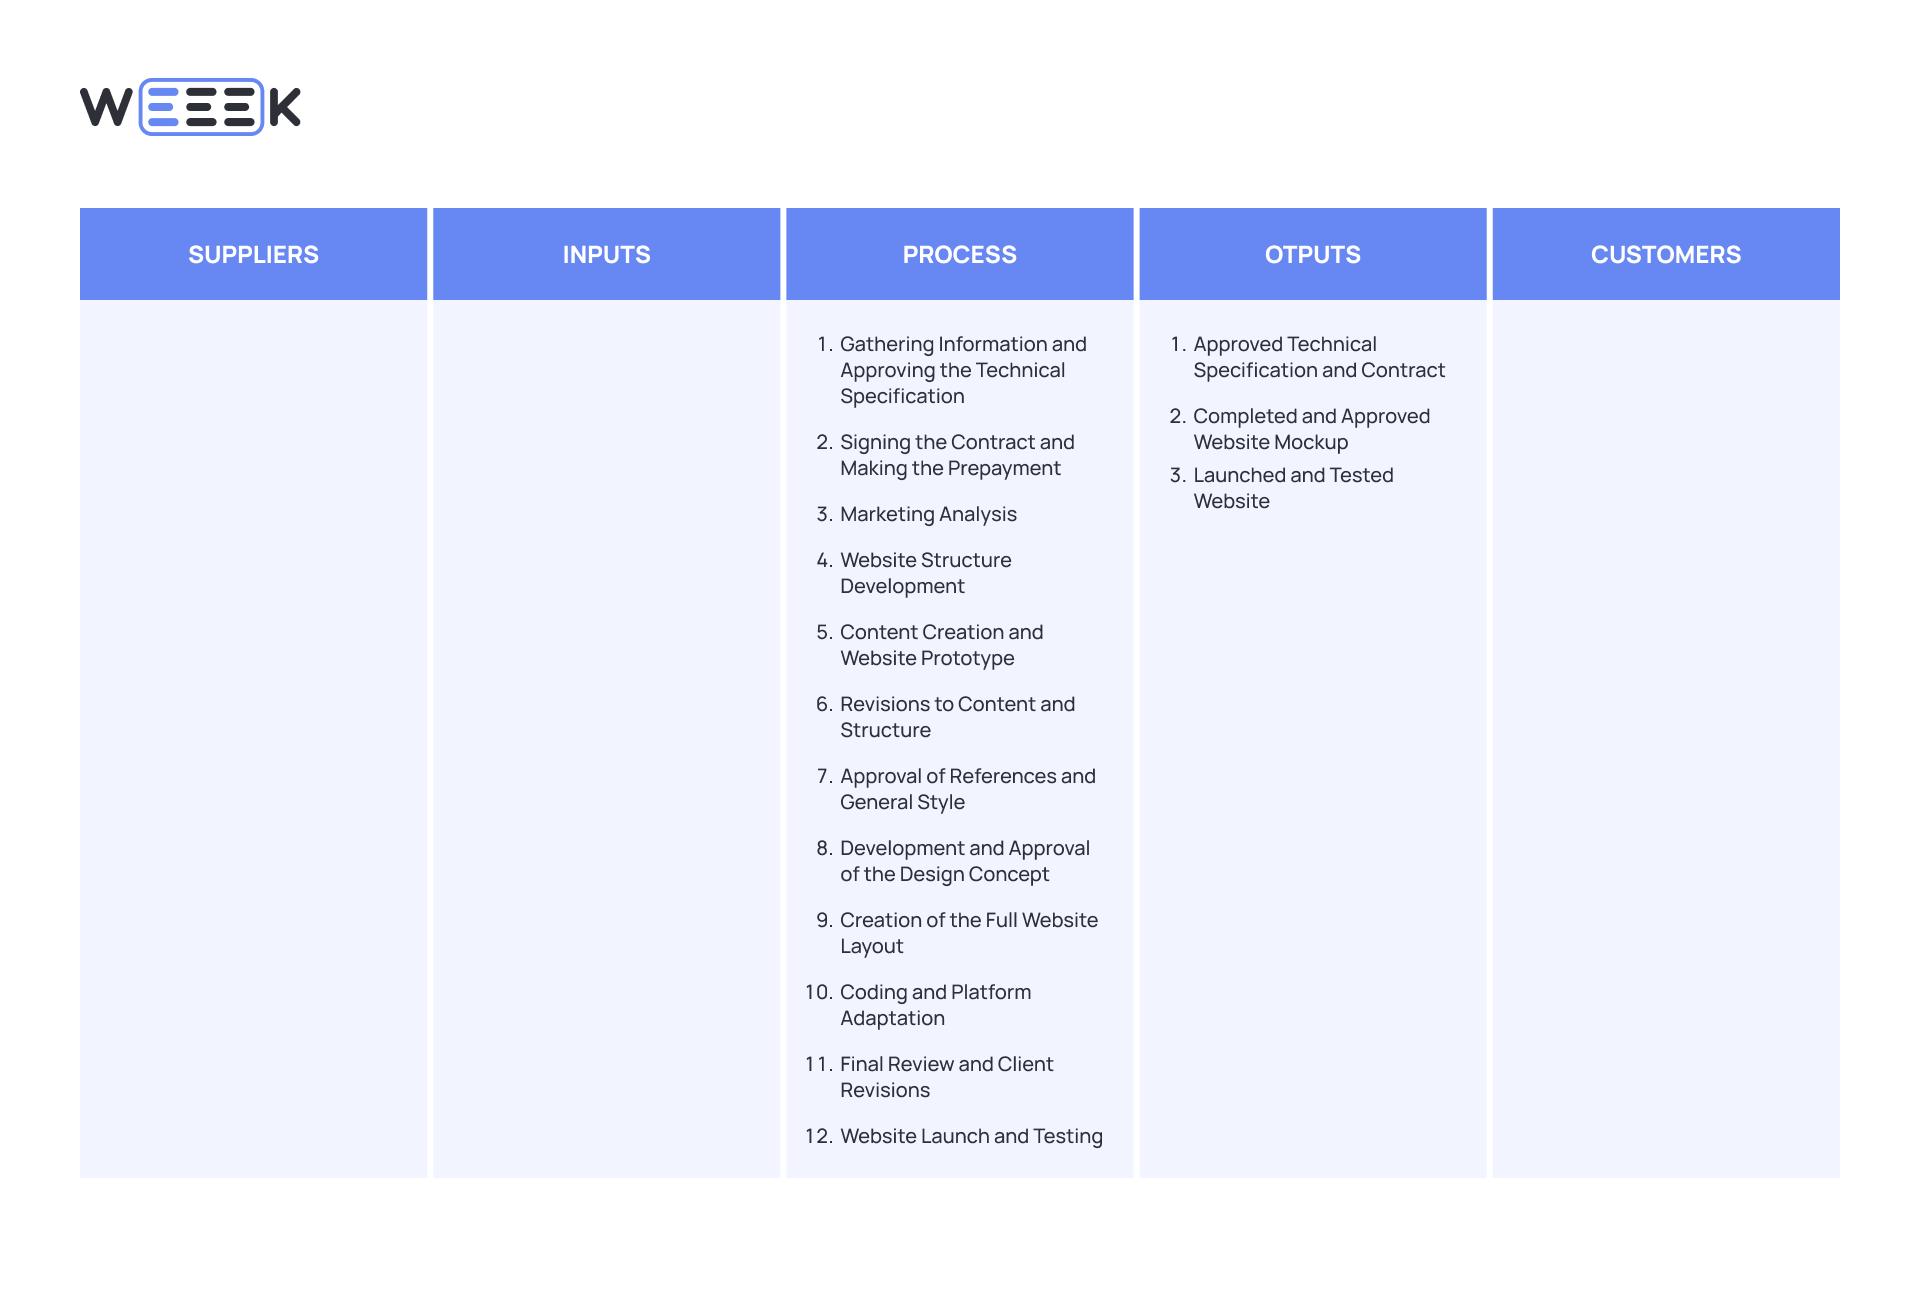
Landing Page Example
When working on landing pages, outputs should go beyond the final deliverable. For instance:
Approved technical specification and contract. These provide documentation in case of future disputes or changes. Design mockup: A vital deliverable, as it represents the approved concept before development begins.
Including these outputs ensures clarity and accountability throughout the process.
Questions About Outputs
- Do the outputs meet client expectations?
- Are there complaints or returns related to the final product?
- What percentage of outputs require rework?
Step 4. Identify Clients
Define your end clients. They can be — External clients. Buyers or users of the final product. Internal clients: Other departments or leadership within the organization.
Common Mistakes
- Overlooking internal clientsForgetting internal clients can lead to issues in later stages of the process.
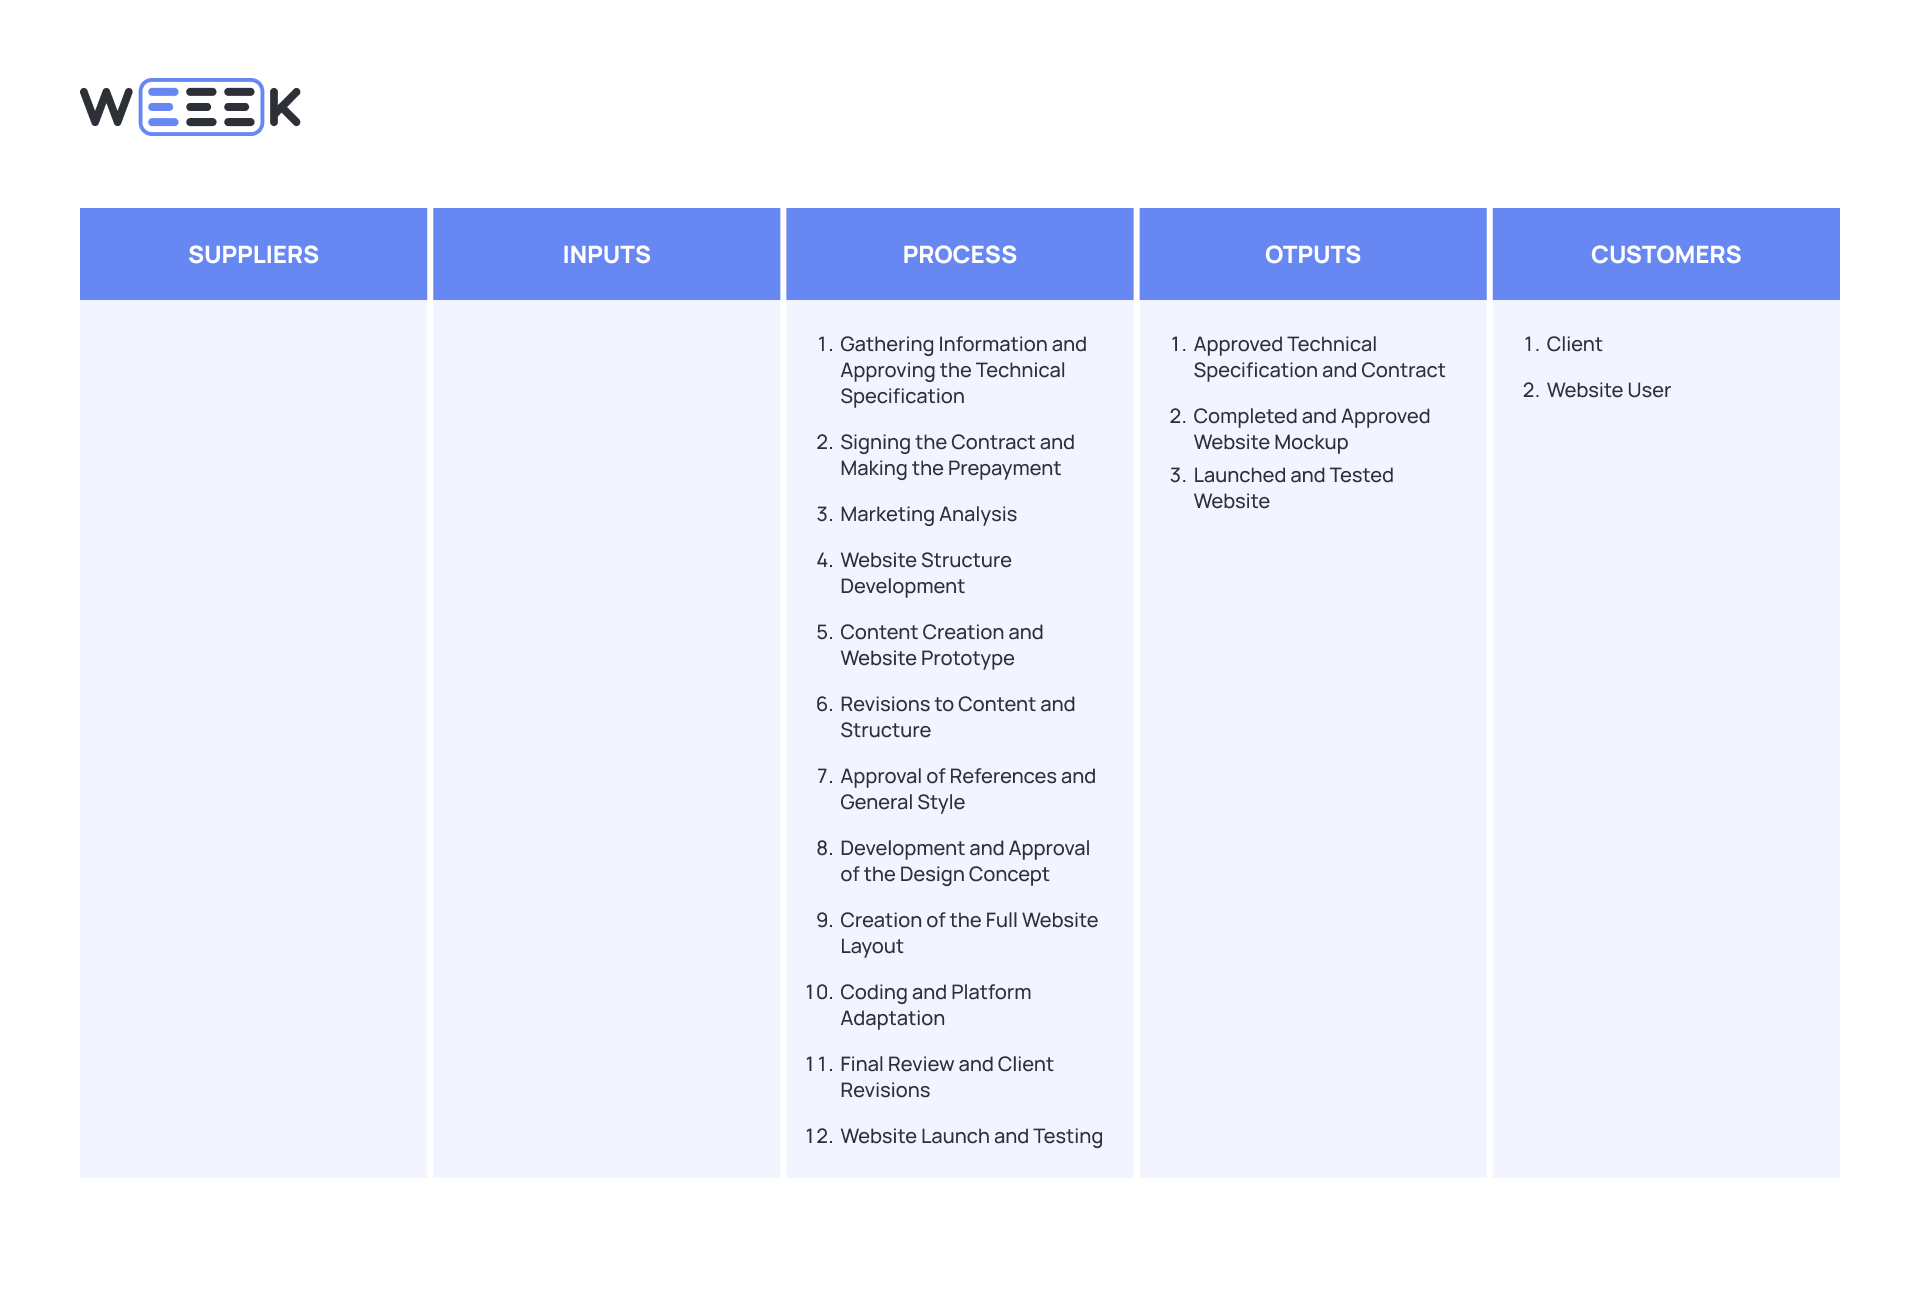
Landing Page Example
In theory, we have one client — the customer who ordered the landing page.In practice, we also consider the end users who will visit the page. Both perspectives need to be taken into account.
Questions About Clients
- Are clients satisfied with the process outcomes?
- Which client requirements pose the biggest challenges?
- How do clients respond to changes in the process?
Step 5. Define Inputs
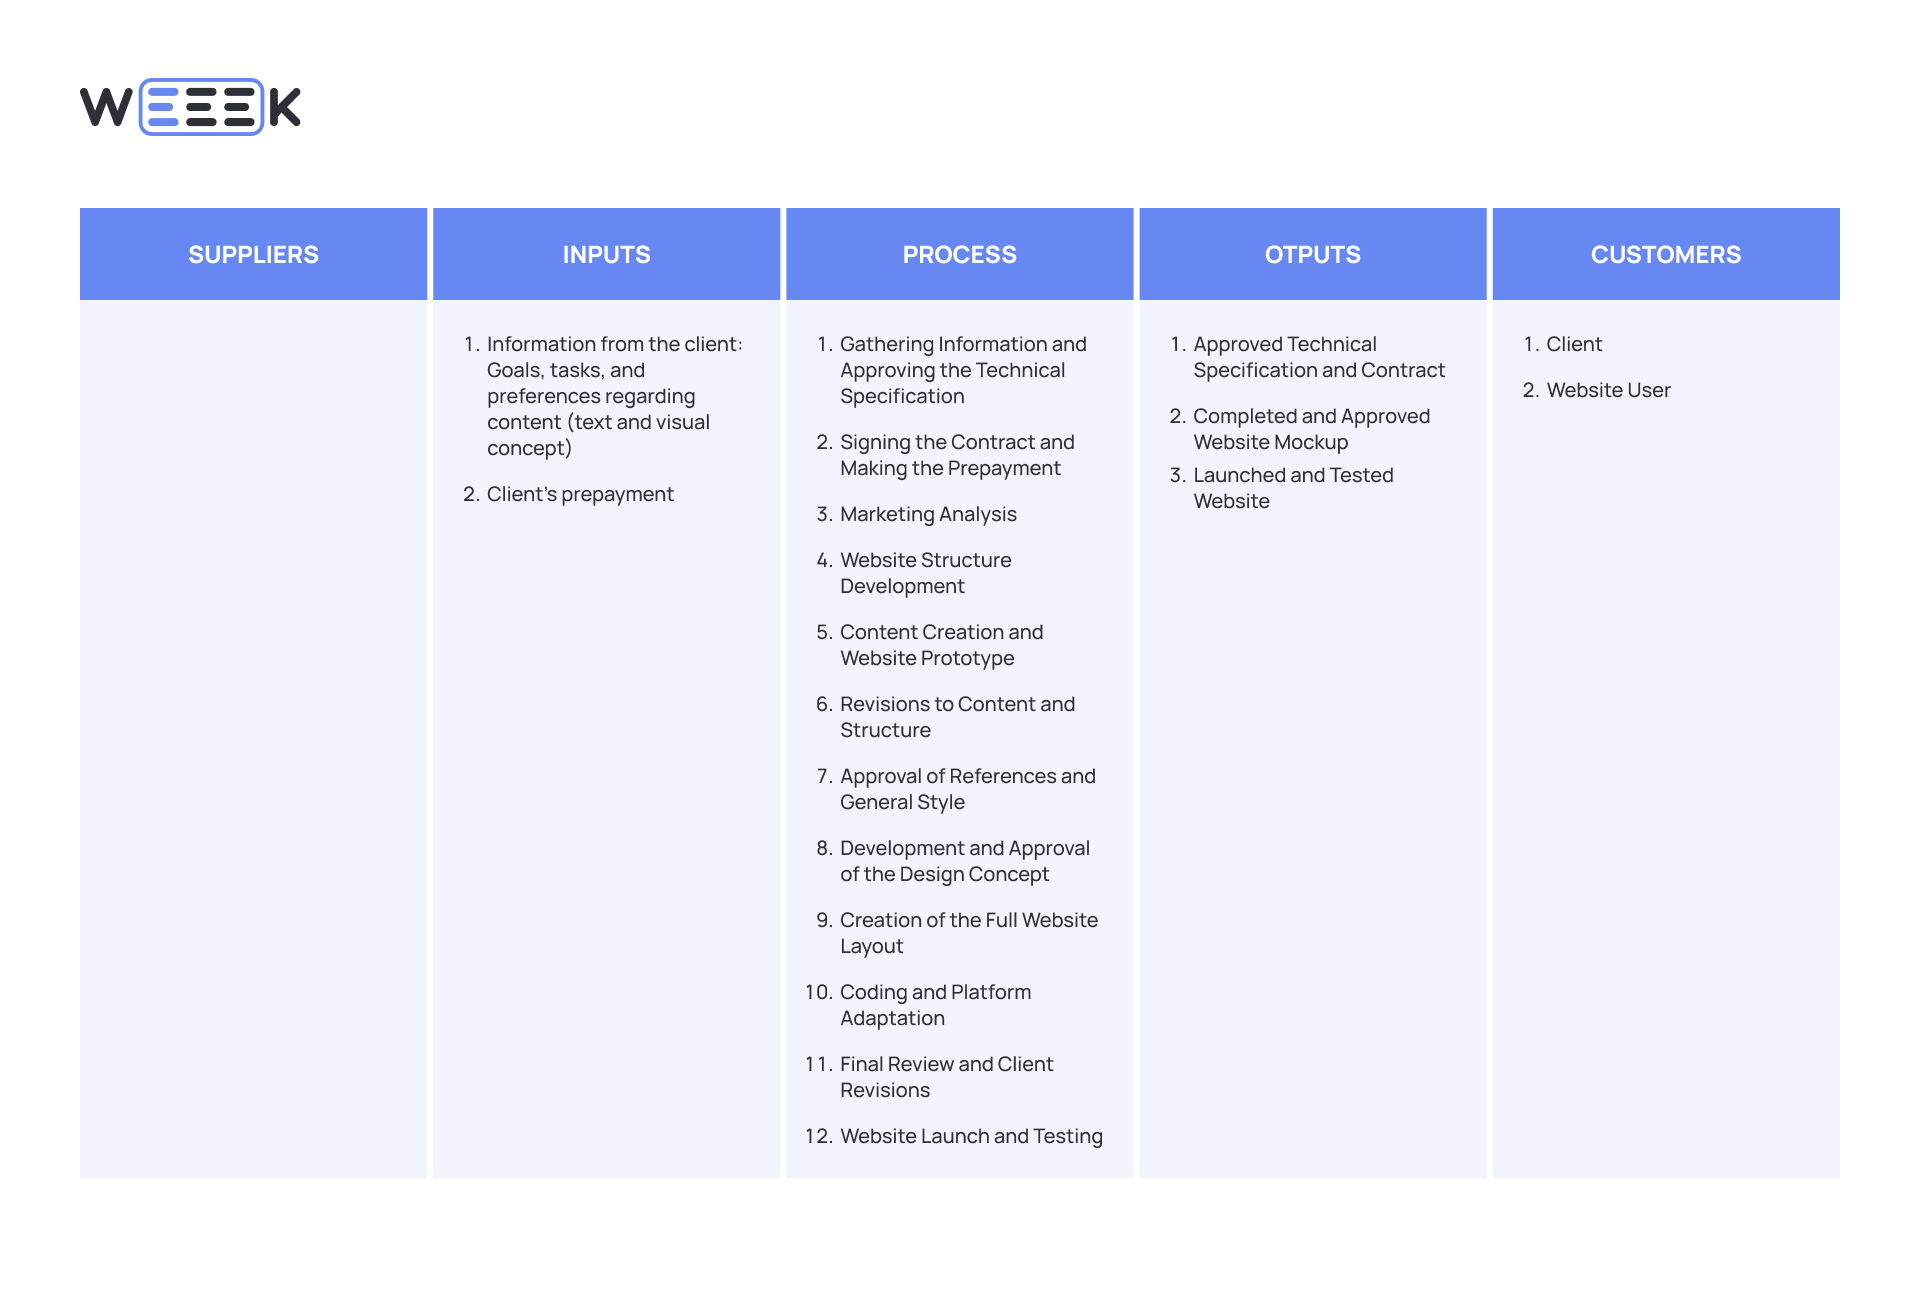
Inputs are the resources required to initiate and sustain the process, including materials, information, and equipment.
Common Mistakes
- Listing unnecessary details. Focus only on inputs that have a direct impact on the process.
- Using vague descriptions. Be precise and clear to avoid misunderstandings.
- Overlooking critical inputs. Don’t forget to include specific methodologies or standards if they play a vital role in the process.
Landing Page Example
While taking notes in a notebook during meetings is helpful, the notebook is a consumable and doesn’t need to be listed as an input.
Similarly, a laptop isn’t a specific input; it’s part of the broader infrastructure. Instead, the focus should be on detailing the specific information required from the client, such as goals, target audience details, and brand guidelines.
Questions About Inputs
- Are the inputs of sufficient quality for the process?
- Which inputs are critically important? What happens if they are missing?
- Are there inputs that frequently cause issues (delays, defects)?
Step 6. Identify Suppliers
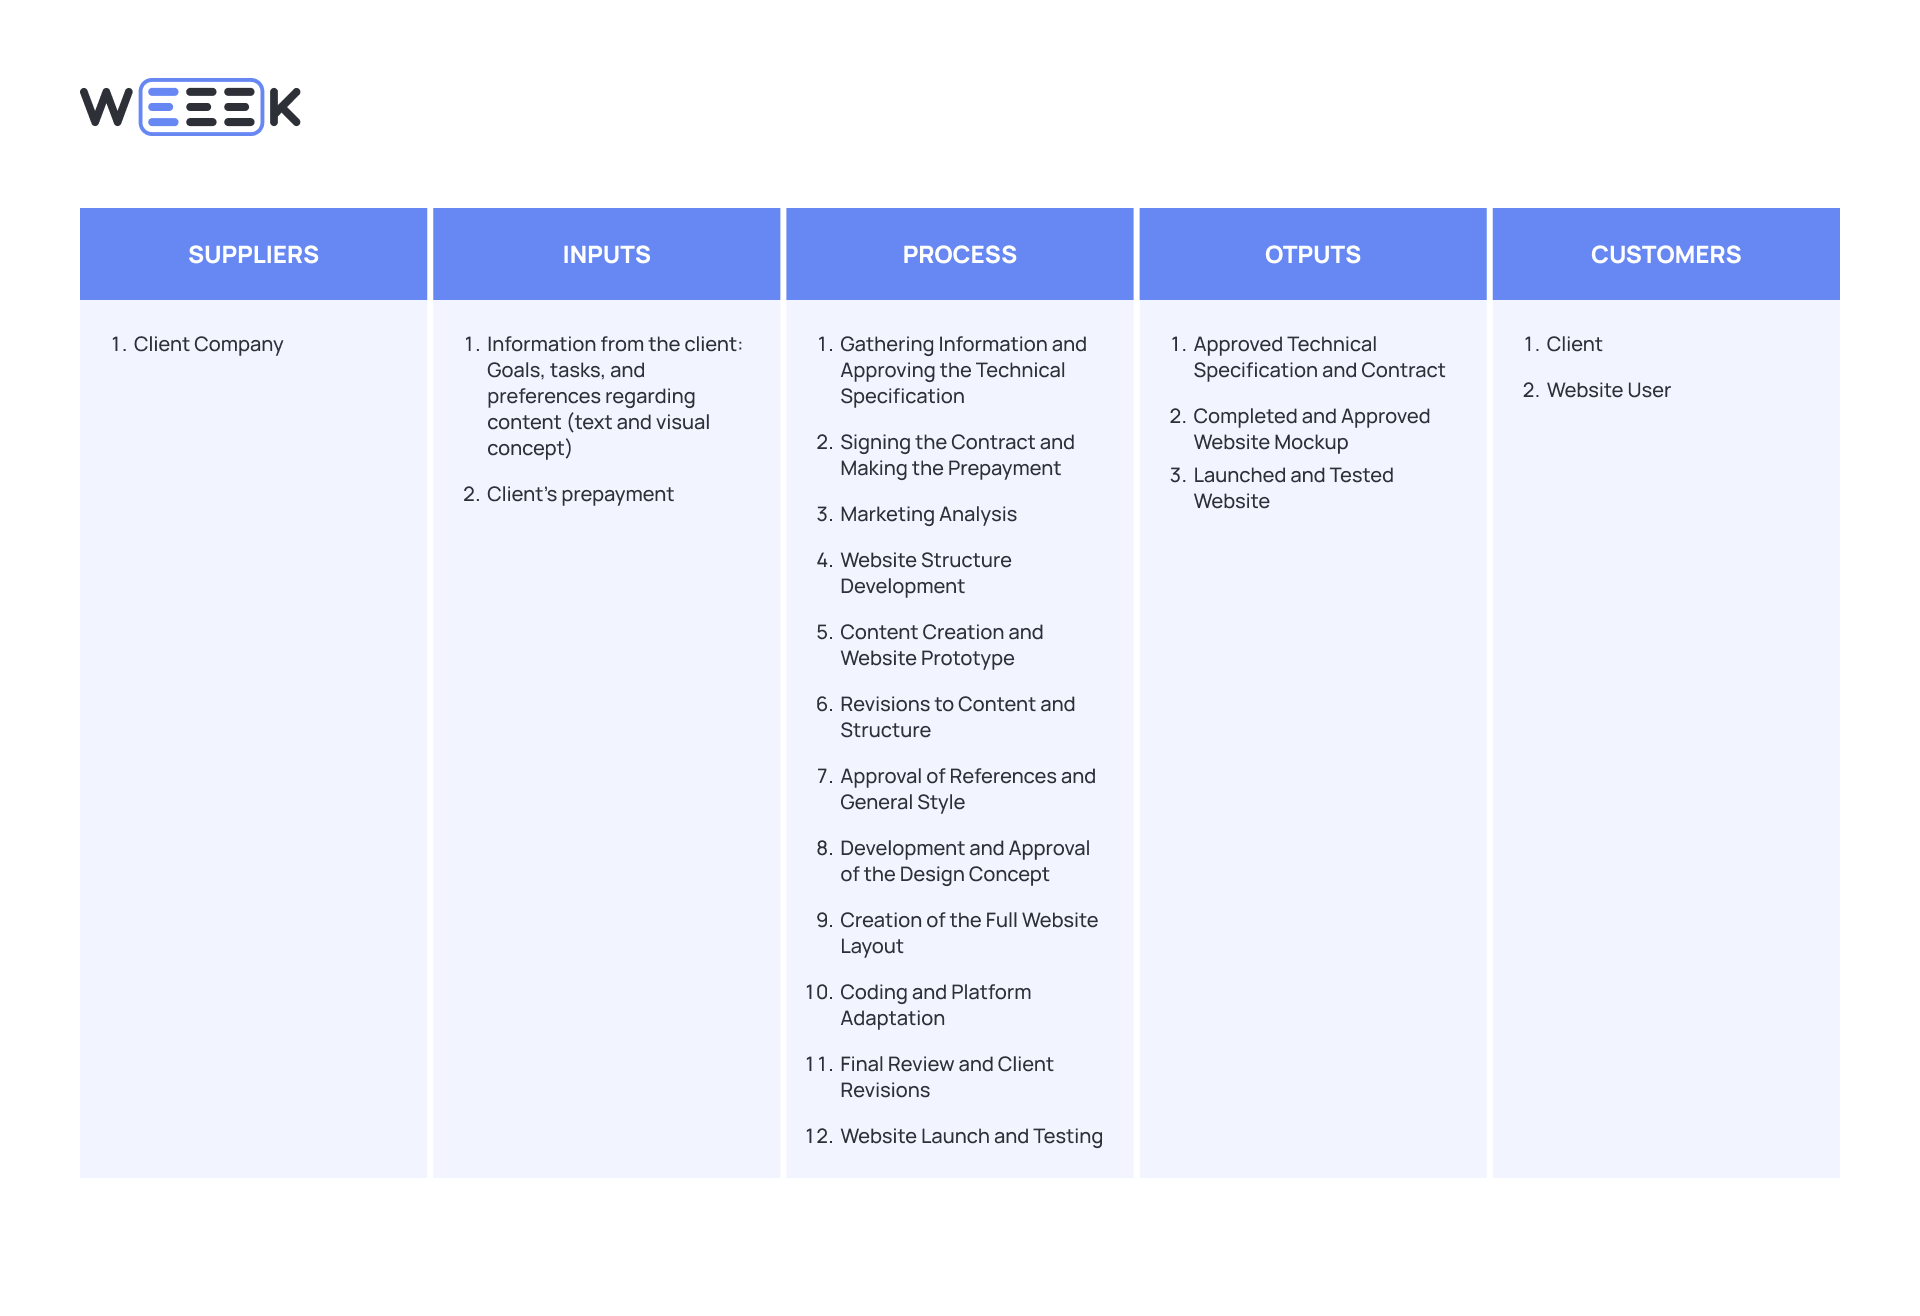
Suppliers can be either external or internal participants, such as departments or employees within the company who provide data, reports, or other materials.
Common Mistakes
- Overlooking internal suppliersFocusing solely on external suppliers can leave the diagram incomplete.
Landing Page Example
To start the process, we need specific data from the client company. Other participants join in at later stages of the workflow.
Questions About Suppliers
- How many suppliers are involved in the process?
- How reliable are they?
- Is there a dependency on a single supplier?
- What happens if a supplier fails to meet their obligations?
Where to Create a SIPOC Diagram — 3 Tools
Creating a SIPOC diagram is simple and doesn’t require specialized software. You can use:
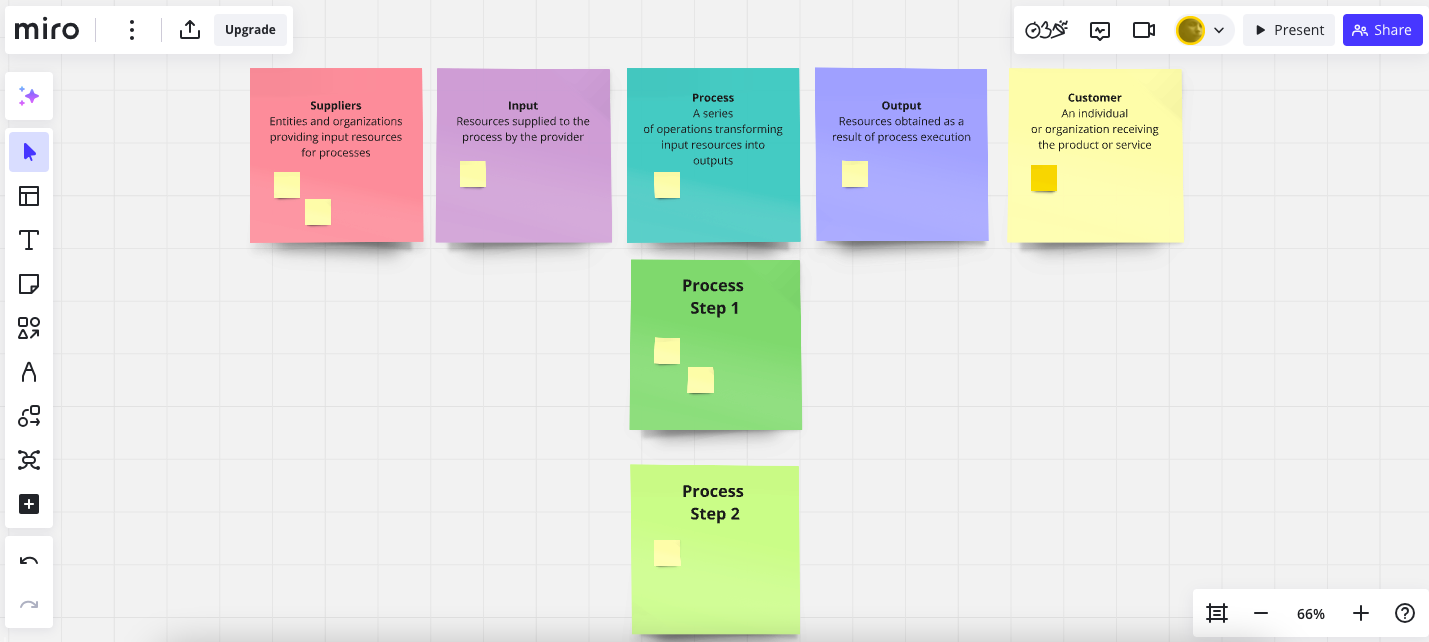
- Online whiteboards like Miro for flexibility and collaboration.
- Design tools like Figma or FigJam for more visually polished diagrams.
A SIPOC diagram is essentially five columns, so there’s no need for a dedicated template. You can adapt a similar template or create one from scratch, which is often faster than setting up a new tool.
We created our sample diagram in Figma, which allows you to download it in multiple formats or share a collaboration link with colleagues for real-time editing and feedback.
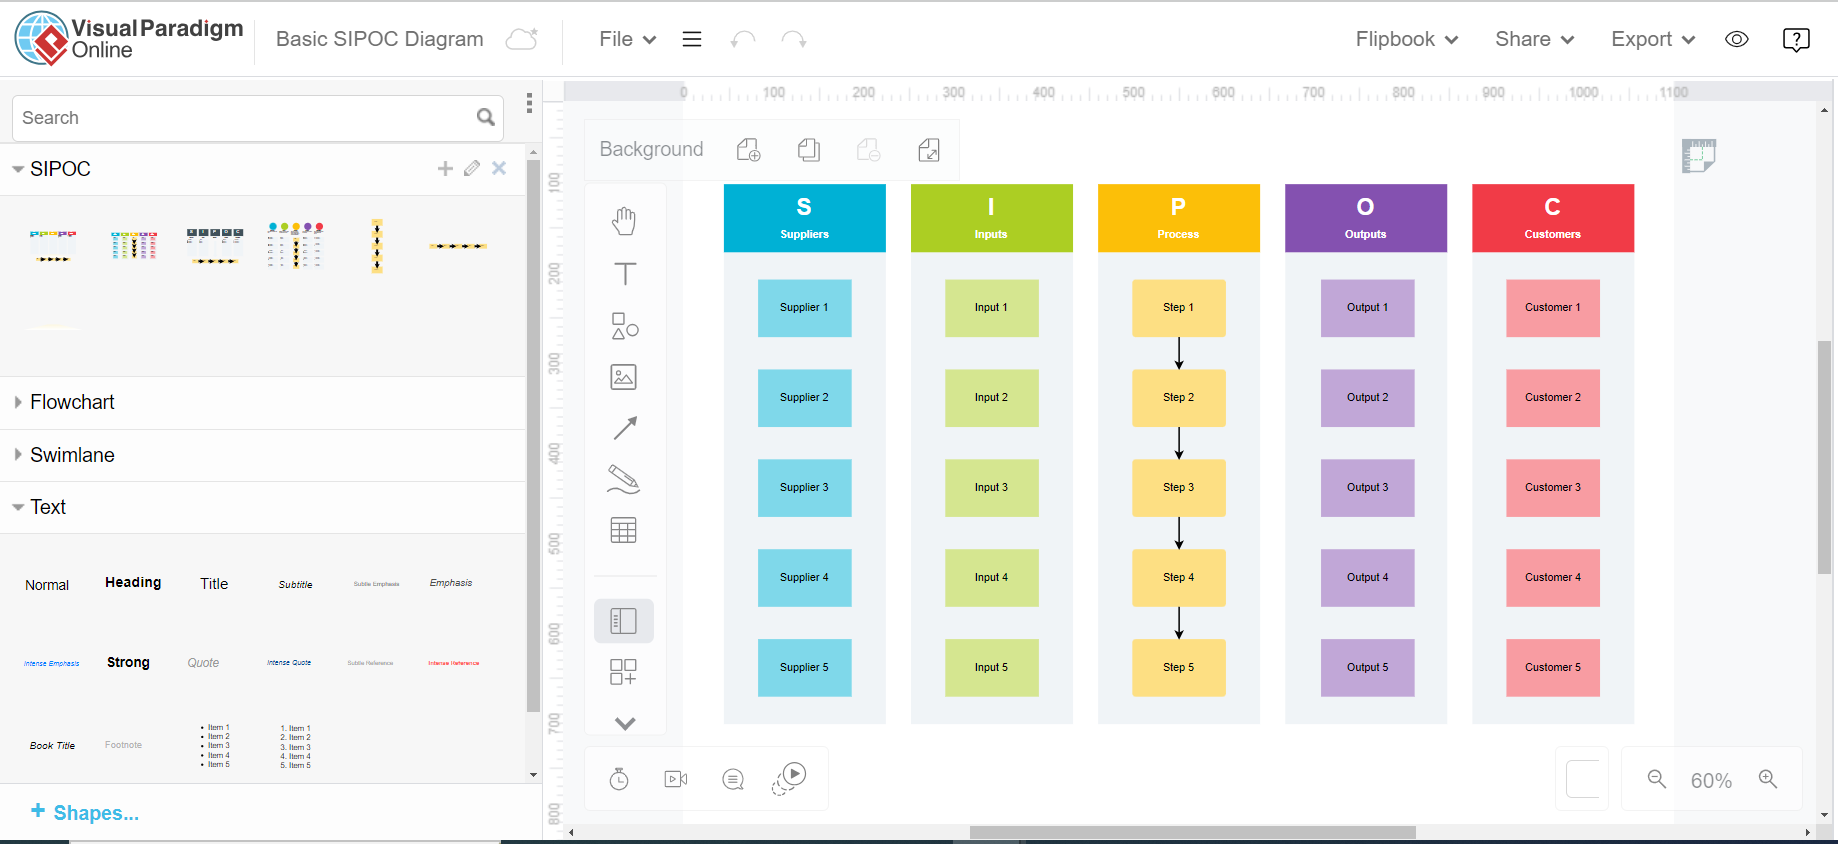
Visual Paradigm Online
A comprehensive tool for modeling business processes and creating diagrams.
Key Features:
- 30-day free trial to explore its capabilities.
- Multiple customizable SIPOC templates available.
- Collaboration tools: Share diagrams with colleagues and grant them editing permissions.
This intuitive platform is perfect for teams seeking an efficient and collaborative approach to designing SIPOC diagrams and other business models.
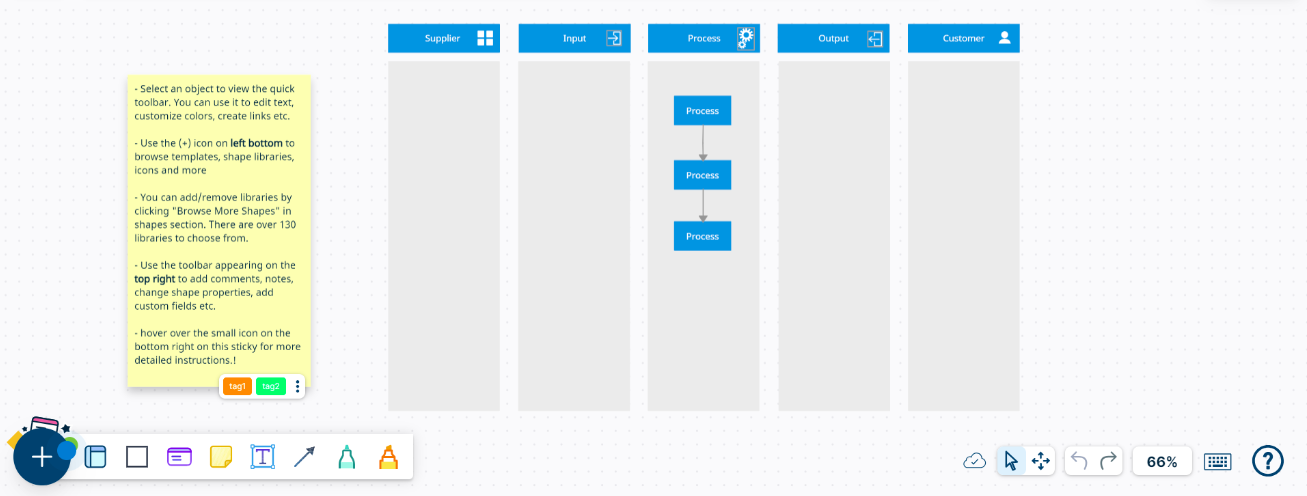
2Creately
Creately is a versatile visual collaboration platform that offers several SIPOC (Suppliers, Inputs, Process, Outputs, Customers) templates to assist in process mapping and analysis. In the free version, users can create up to three documents for personal use. To share diagrams with colleagues and enable collaborative editing, a paid subscription is required. Completed diagrams can be downloaded in various formats for easy sharing and integration into other documents.
Key Features:
- Diagram Creation and Design. Creately provides tools for creating a wide range of diagrams, including SIPOC diagrams, flowcharts, and organizational charts.
- Free Version. Allows the creation of up to three documents for personal use.
- Paid Version. Enables sharing with colleagues, collaborative editing, and access to additional features.
- Export Options. Completed diagrams can be exported in formats such as JPEG, PNG, SVG, and PDF, facilitating easy sharing and integration into presentations and reports.
For more detailed information on Creately's SIPOC templates and pricing plans, you can visit their official website.
Lucidchart
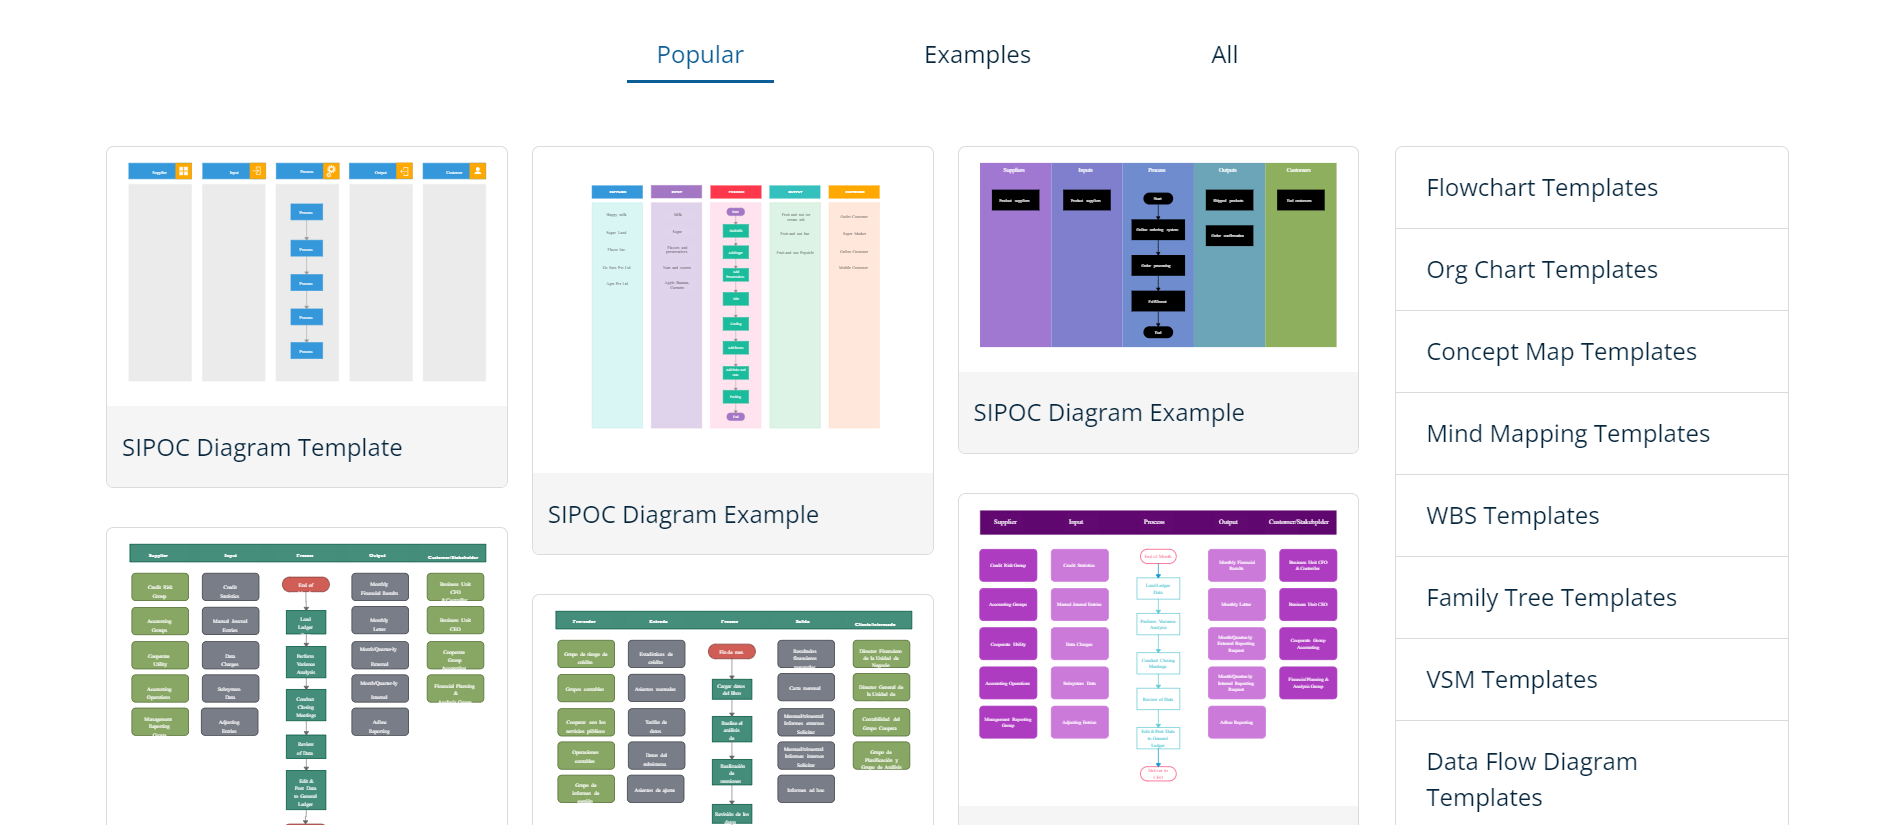
Like Creately, the free version allows only three documents. For SIPOC, there is one built-in template, which supports up to 60 shapes in the free version. Collaborative editing with colleagues is included.
A visualization platform with a dedicated SIPOC template. It allows up to 60 shapes to be added and edited collaboratively in the free version.
Refined Text
- A SIPOC diagram is a valuable tool for diagnosing business processes — it’s effective for both established workflows and new product development.
- While creating the diagram itself is straightforward, gathering the required information demands time and effort. This involves studying the processes, engaging with the team, analyzing resources and workflow stages, identifying issues, and thoroughly reviewing all findings.
- The resulting diagram offers a clear and comprehensive view of how your business processes function — how products are created and potential obstacles that might disrupt them. It’s an excellent way to gain a holistic understanding of your operations!


