The term «matrix» made its way into project management from algebra. In mathematics, a matrix is a structured table used to record multiple equations and calculate a range of values based on them.
In simple terms: one table — multiple variables — countless outcomes depending on how the variables are combined.
In the realm of project management, matrices serve a similar purpose, bringing together numerous parameters. They act as visual tools that streamline decision-making, helping to distinguish the best, good, and poor options while organizing complex information in a compact format.
Examples include:
- RACI-DACI matrices for assigning roles and clarifying responsibilities within projects.
- The Eisenhower Matrix for setting task priorities.
Now, let’s dive into five matrices that can simplify decision-making — whether for project management or everyday situations.
The Pugh Matrix
When there’s a single objective but multiple ways to achieve it, the Pugh Matrix is a valuable tool for selecting the optimal approach.
For instance, you might need to decide whether to outsource or handle a task in-house, invest time in creating high-quality animations, or settle for a quicker, simpler solution.
✅ The Pugh Matrix is particularly popular in design and product development for comparing alternatives against a defined standard.
How the Pugh Matrix Works
- List all alternative solutions in the first column.
- Identify evaluation criteria for the remaining columns, such as speed, quality, cost, or other relevant factors.
- Rate each alternative for each criterion on a scale from 1 to 5.
- Add up the scores for each option and compare the results.
Example. Imagine you’re working on a personal project and need to decide whether to design it yourself or hire professional designers. Doing it yourself is faster, as it avoids the need for drafting technical specifications, answering questions, and overseeing the process. However, the quality may not be as high. Hiring professional designers takes more time but delivers higher-quality results.
After adding up the scores, you might determine that hiring professionals is the better option. Although it requires more time, the superior quality makes it the optimal choice.
Advantages and Disadvantages
✅ Advantages:
- Simple and efficient. Quickly structures evaluations and allows for easy comparison of alternatives.
- Transparent process. Clearly defined and rated criteria make the decision-making process straightforward and understandable.
- Versatile comparison. Supports both quantitative and qualitative assessments, providing a balanced evaluation of strengths and weaknesses.
- Saves time and resources. Leverages existing factors and decisions to streamline the process.
❌ Disadvantages:
- Ambiguous or excessive criteria. Vague or overly numerous criteria can distort the results and reduce clarity.
- Risk of oversimplification. Complex issues may be reduced to overly simplistic terms, potentially missing critical details.
- Subjectivity. The importance of criteria and assigned scores can vary depending on personal judgment, making the results less reliable without adequate expertise.
The Eisenhower Matrix
This matrix categorizes tasks based on two key criteria: urgency and importance. It’s a powerful tool for breaking free from the «firefighting» mentality — the overwhelming sense that all tasks are both urgent and important, leaving no room to prioritize effectively.
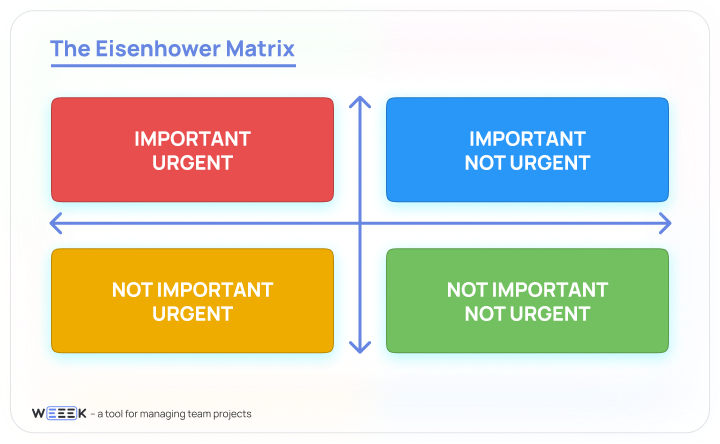
✅ Highly effective for personal time management and task prioritization—whether planning your day or managing tasks during a project phase, such as a sprint.
How It Works
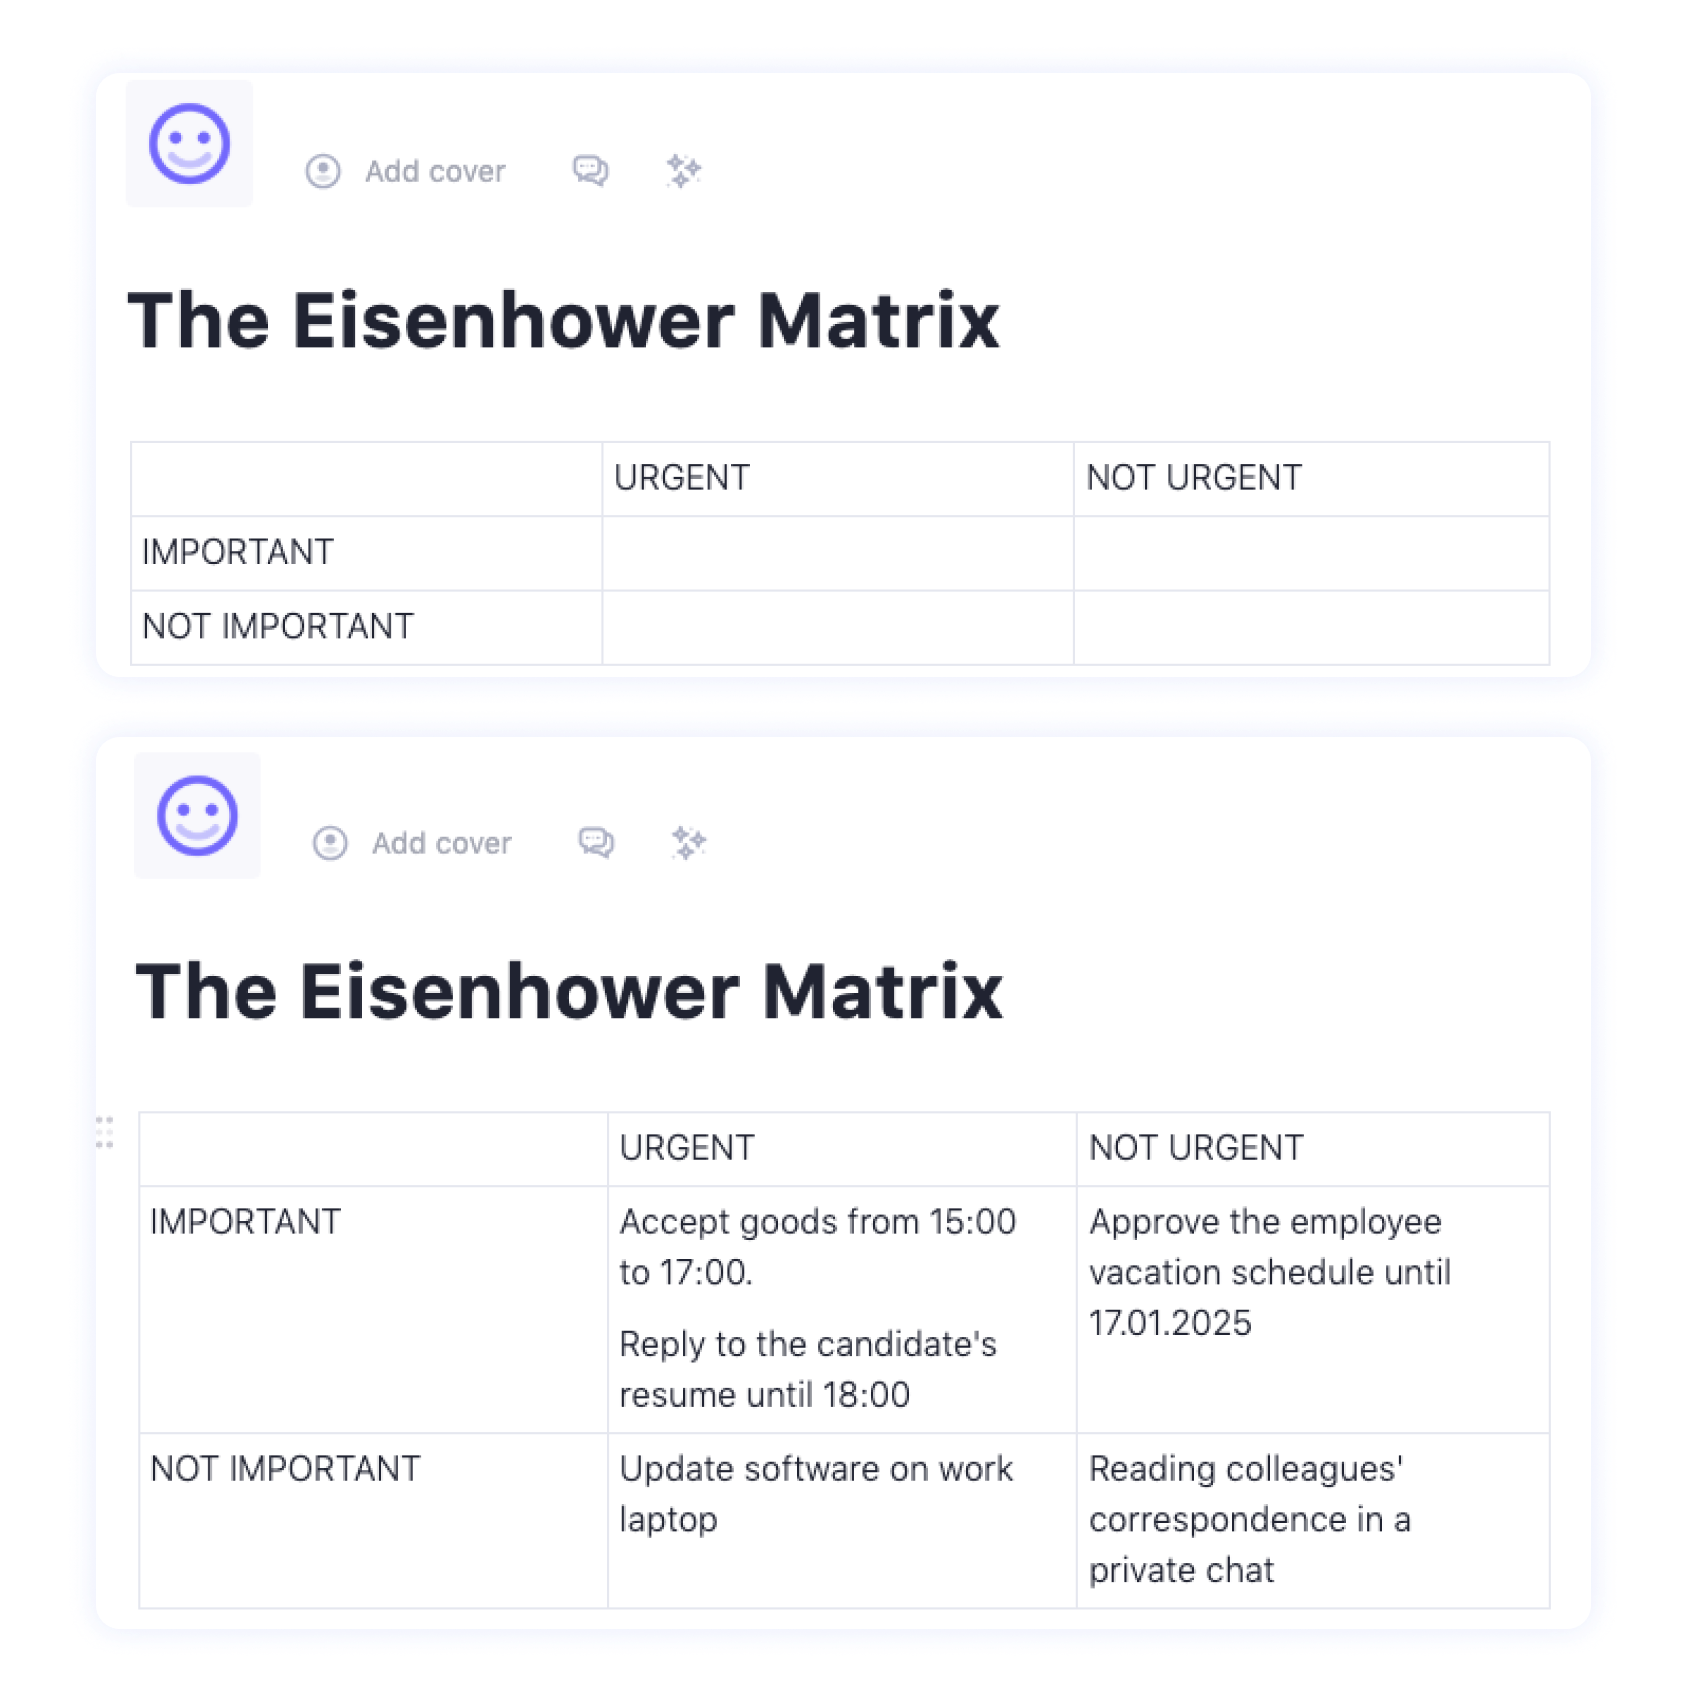
In a grid or table, create two columns. Urgent and Not Urgent, and two rows — Important and Not Important. This setup divides tasks into four categories based on their priority and urgency.
You can easily create this matrix on paper or in a task management tool for better organization.
Advantages and Disadvantages
✅ Advantages:
- Crisis management tool. Helps prioritize and address the most critical tasks immediately while postponing or delegating less important ones.
- Eliminates unnecessary tasks. Simplifies your to-do list by discarding items in the «Important and Not Urgent» quadrant.
- Quick and simple to create. Requires only a task list to get started.
❌ Disadvantages:
- Difficulty in prioritization. Deciding what goes where can be challenging, leading to overcrowded «Important and Urgent» or «Important but Not Urgent» quadrants.
- Limited flexibility. With only four categories, the matrix may not address nuanced or complex situations.
Comparison Matrix
A practical tool for evaluating multiple options to identify the best one. The «Comparison» sections on websites are a perfect example of this matrix. It’s versatile, allowing you to choose anything from the best planetary mixer to conducting a competitive analysis of companies.
✅ In projects. Ideal for market or competitor analysis.
✅ In personal life. Helpful for comparing multiple options, such as when buying a house or a car.
How It Works
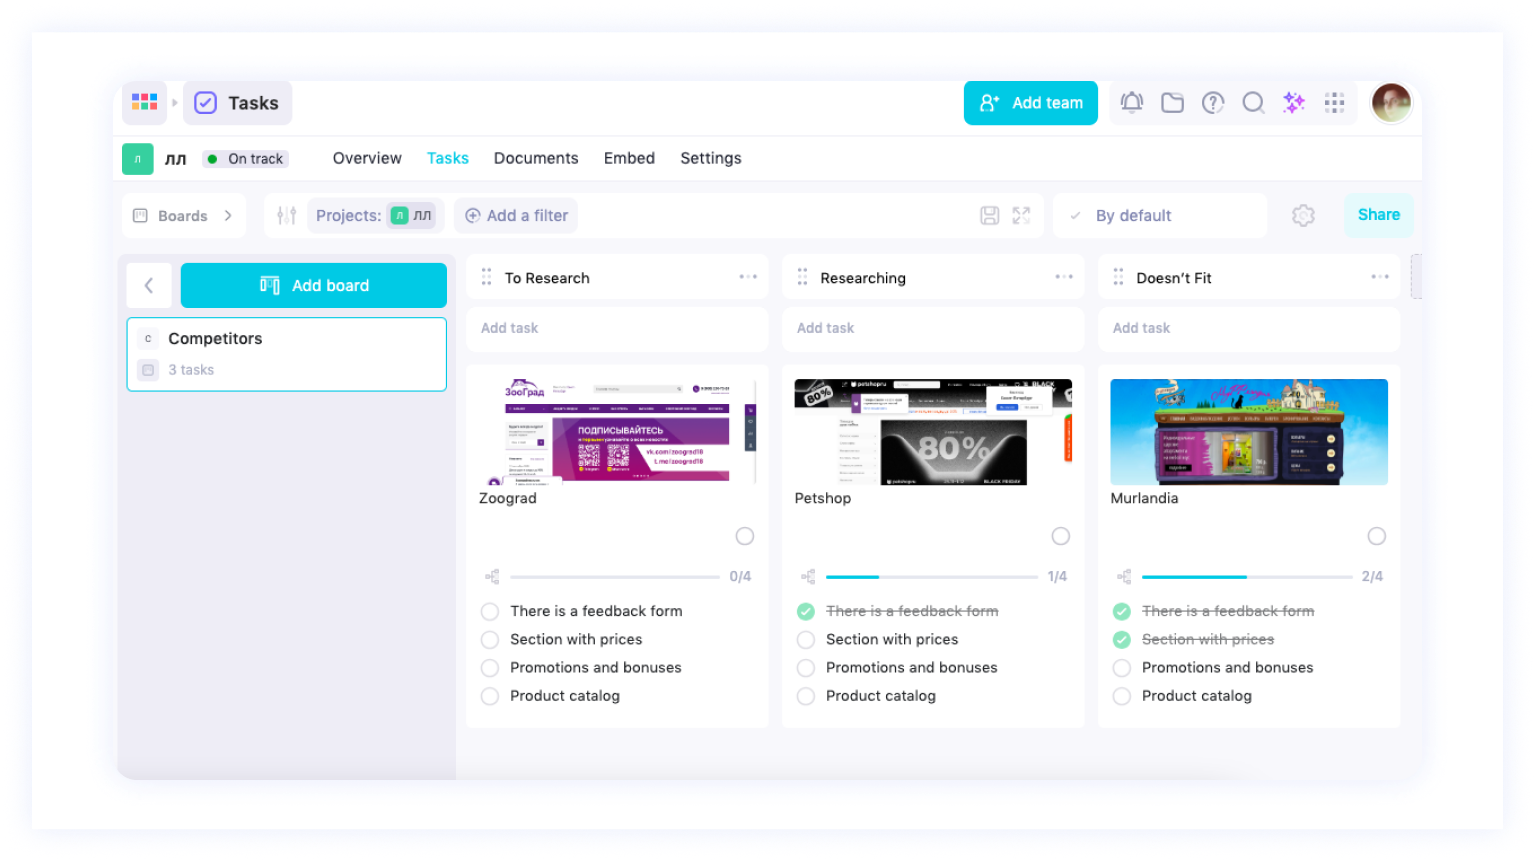
You can easily create a comparison matrix using Kanban boards. For example, if your goal is to compare landing page designs from competitors:
- Set up columns. Name them «Research», «Researching», and «Doesn’t Fit».
- Visualize options. Upload screenshots to card covers for a clear visual representation.
- Add details. Populate the cards with information for analysis, such as pros, cons, and unique features.
This method organizes the evaluation process, making comparisons intuitive and efficient.
Advantages and Disadvantages
✅ Advantages:
- Comprehensive evaluation. Allows for assessing multiple criteria across companies, items, or processes in a unified view.
- Visual clarity. Displays all relevant information in one place, removing the need to toggle between windows or sources.
❌ Disadvantages:
- Risk of clutter. Including too many irrelevant or outdated criteria can make the matrix overwhelming and reduce its utility.
Decision-Making Matrix: Descartes' Square
Descartes' Square is a simple yet effective decision-making tool designed for choosing between two options, such as «to do» or «not to do».
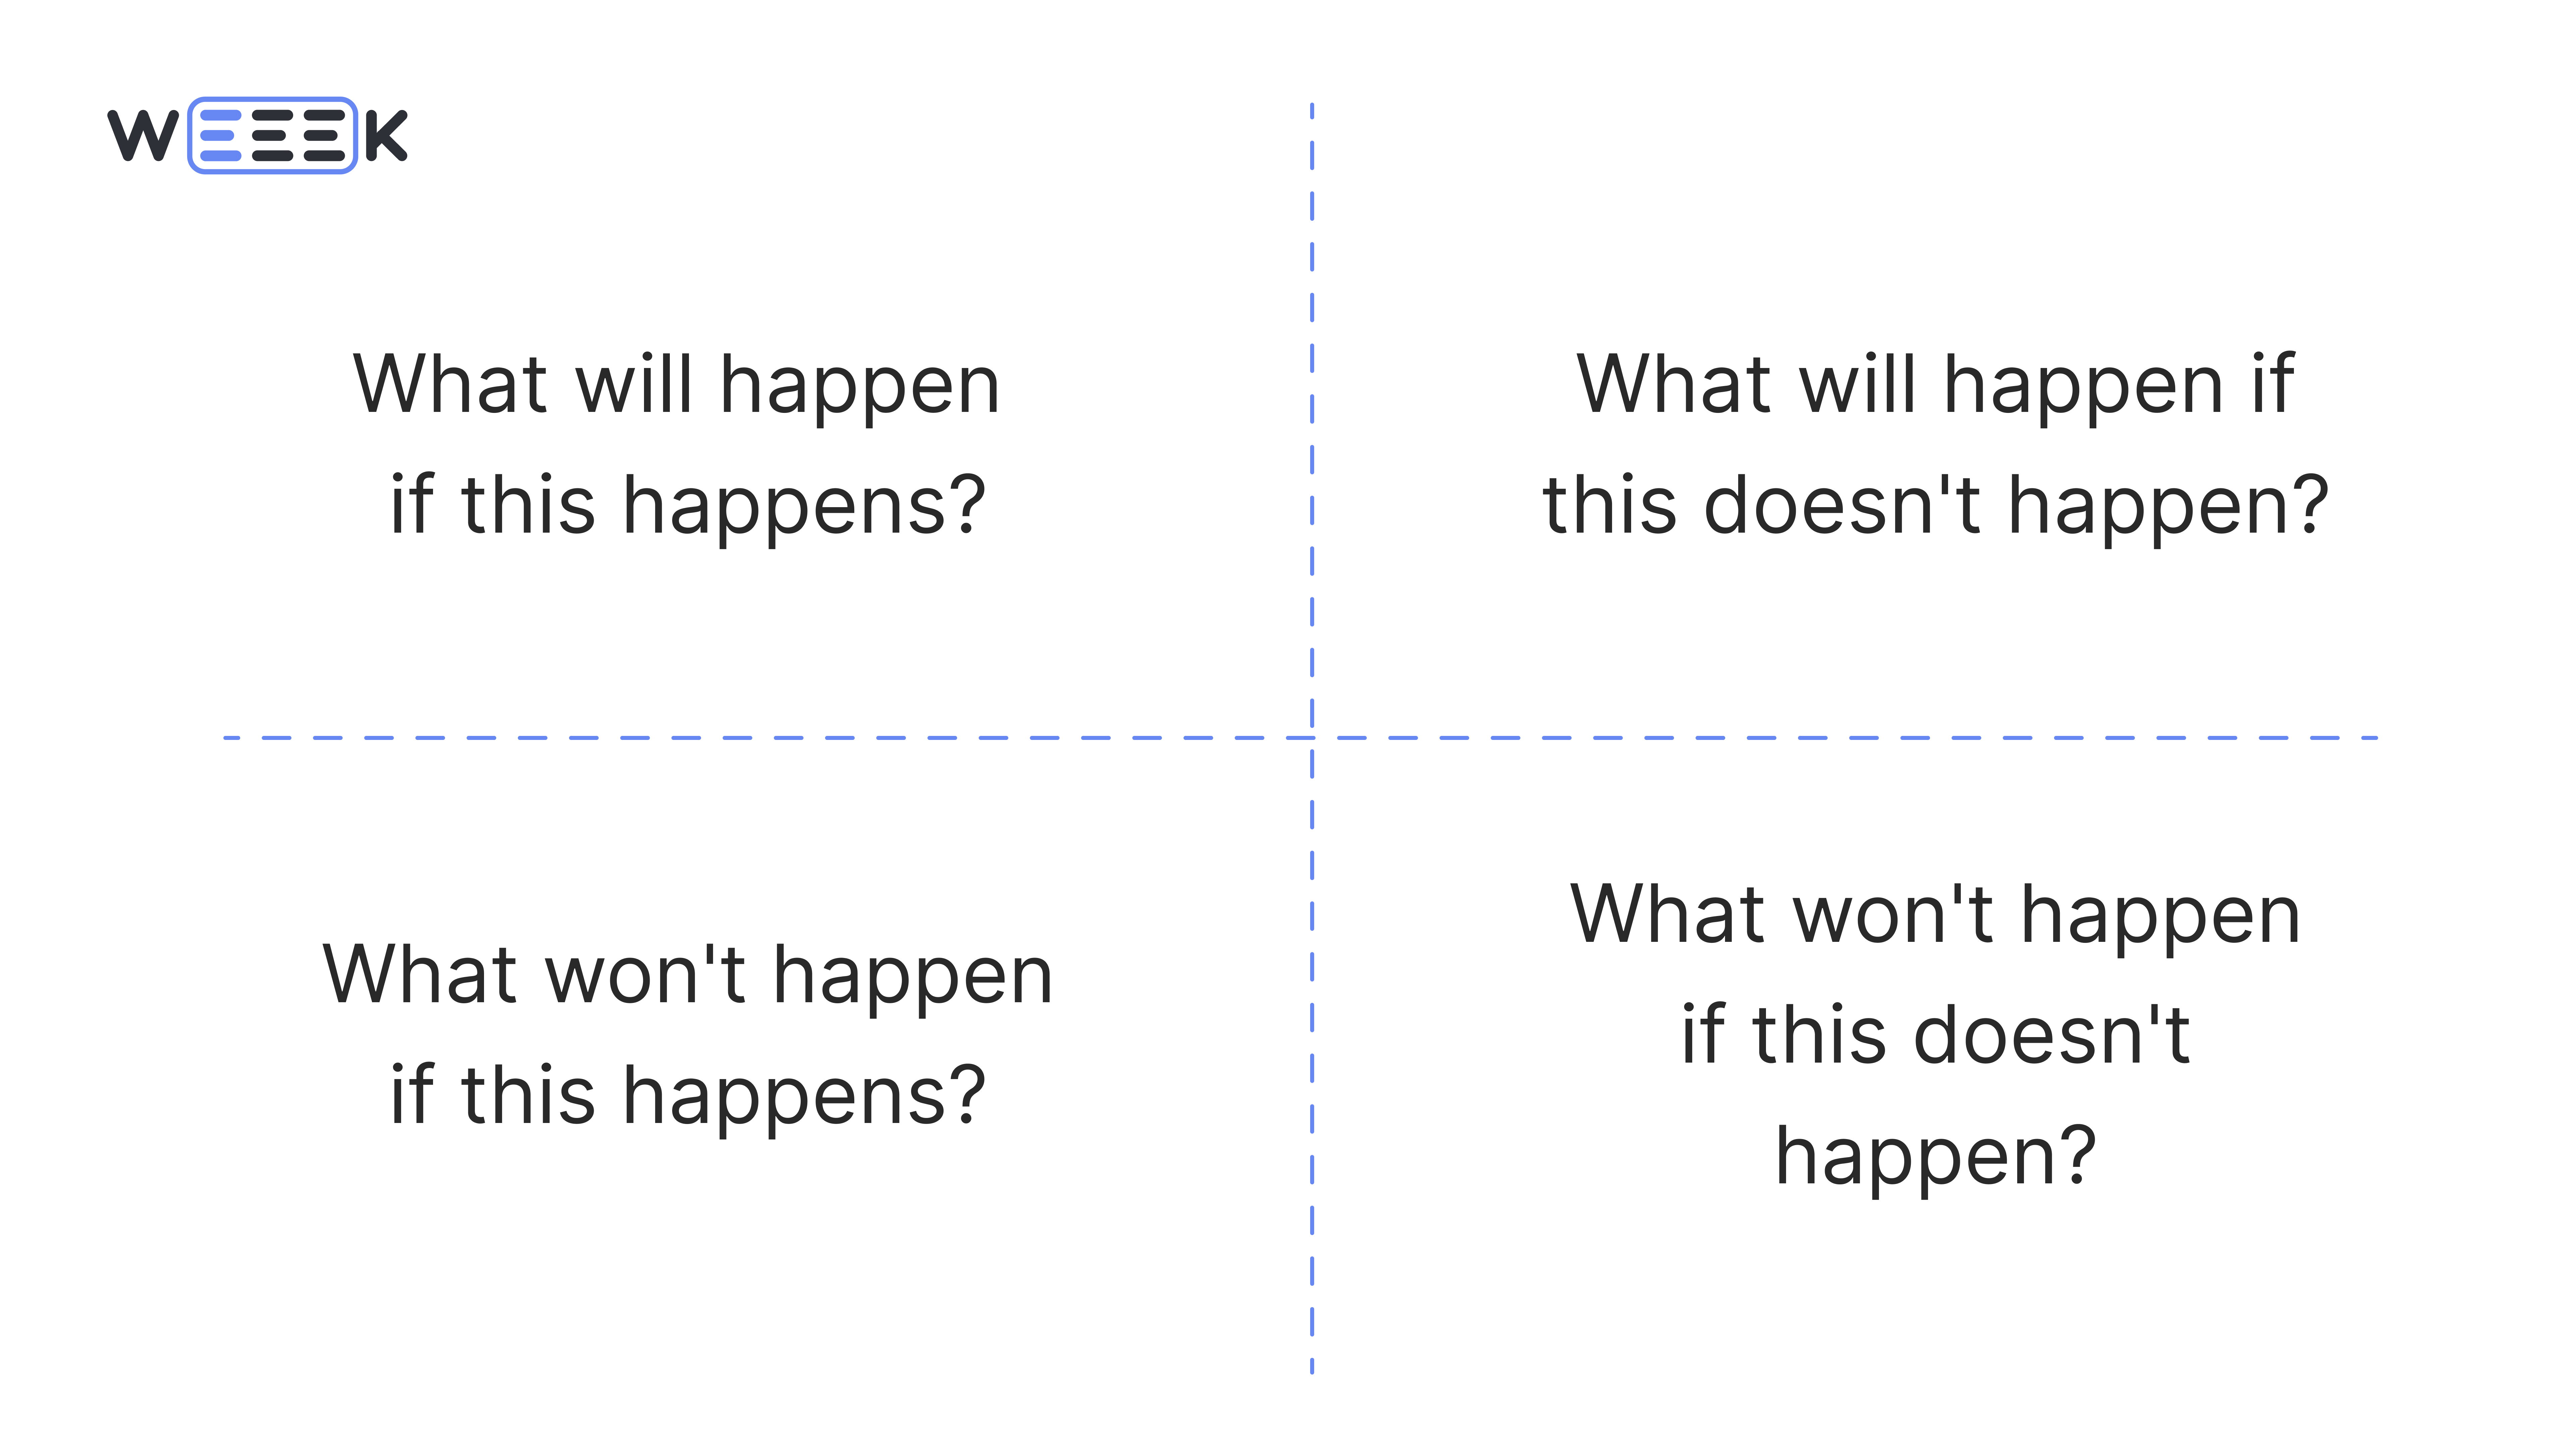
✅ Best for Resolving Dilemmas. Ideal for situations where you need to choose between two similar projects, offers, or job candidates. It’s particularly effective for navigating complex decisions.
How It Works
You can create Descartes' Square using pen and paper or a task management tool. The idea is to divide a space into four sections and answer these questions:
- What will I gain if this happens?
- What will I gain if this doesn’t happen?
- What will I lose if this happens?
- What will I lose if this doesn’t happen?
Let’s consider a situation: a coffee shop owner notices declining sales and is thinking about relocating to a new location.
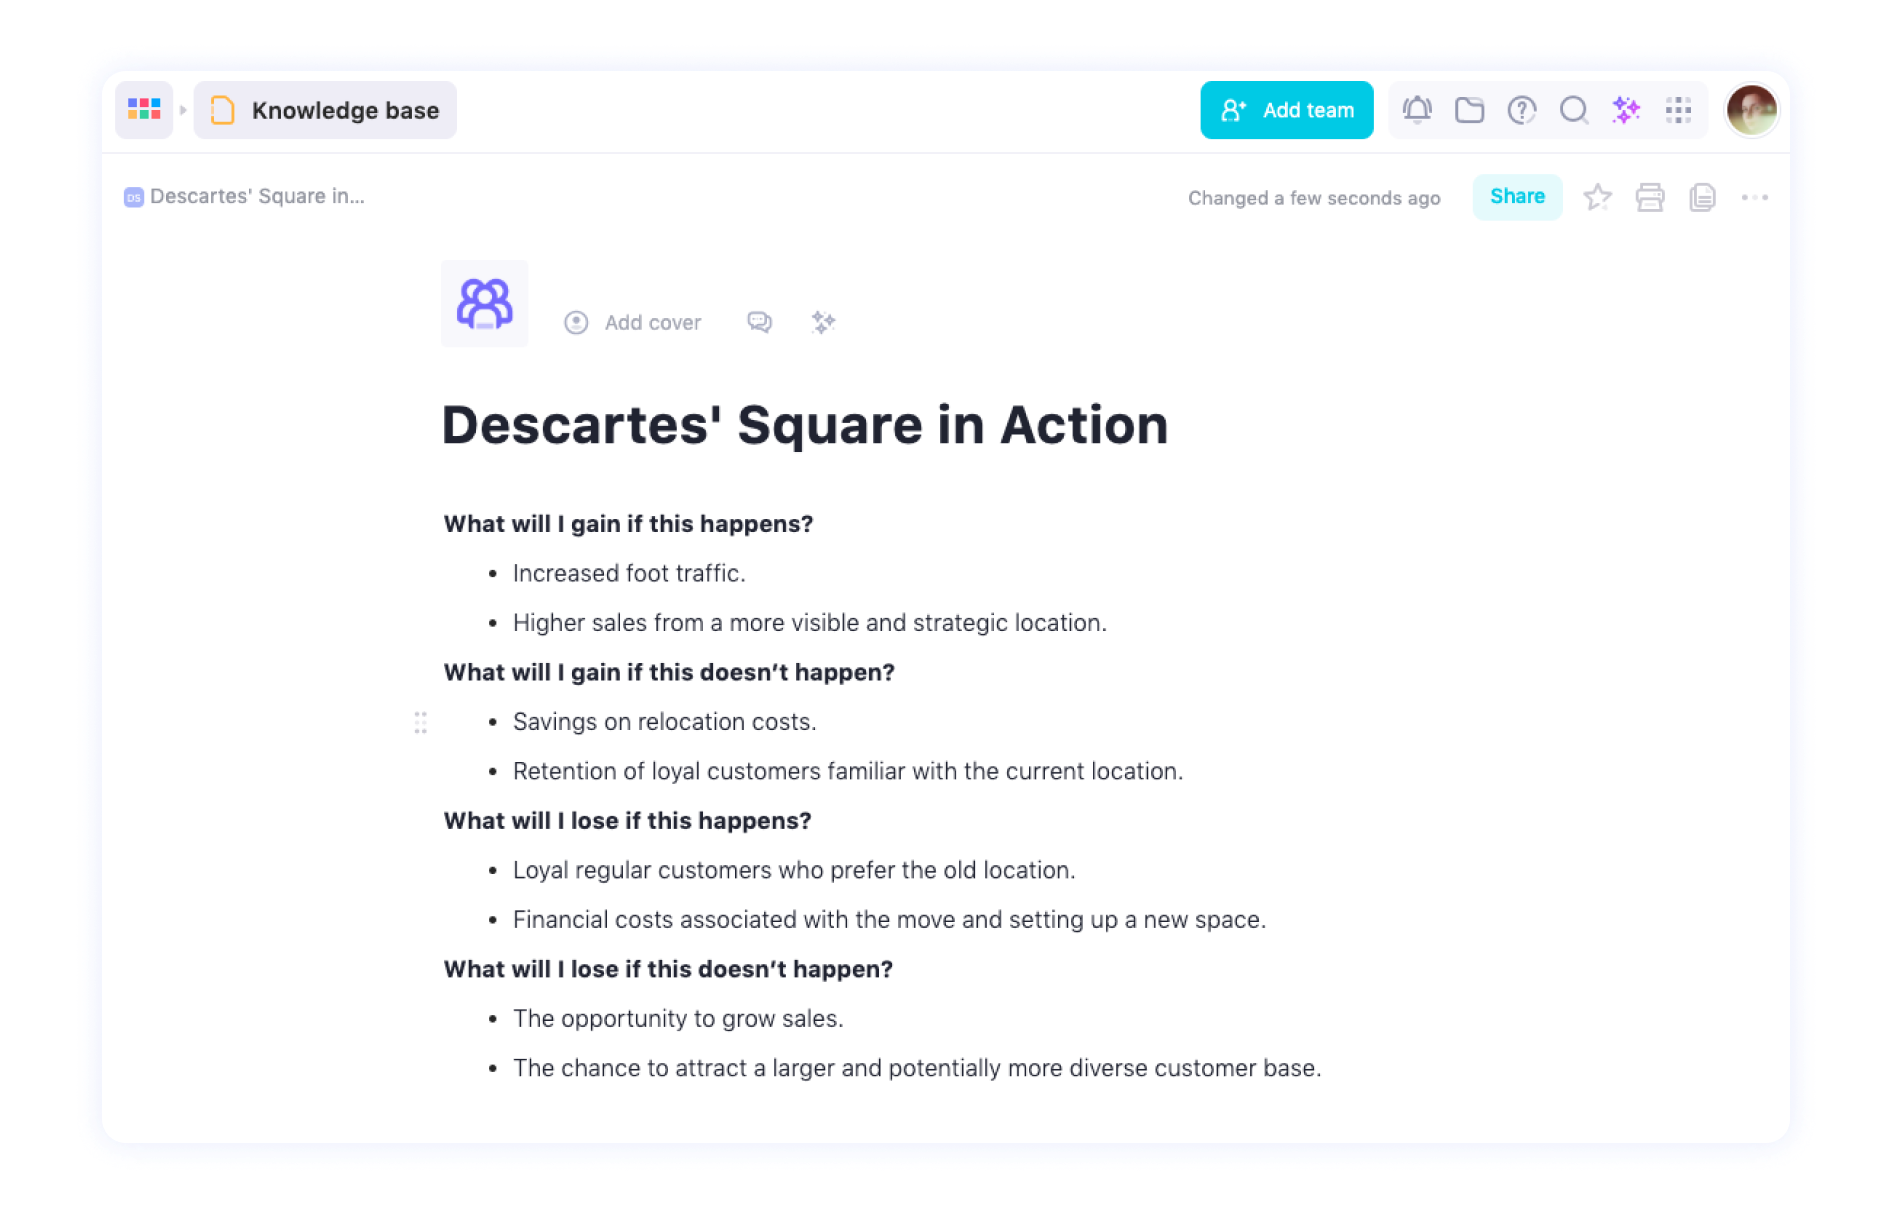
While Descartes' Square is useful for individual decision-making, it can be adapted for collaborative use in business, projects, or team scenarios. Follow this step-by-step process:
- Gather the Team for Brainstorming. Create a large Descartes' Square visible to all participants, either on a poster board or an online whiteboard for virtual meetings.
- Individual Brainstorming. Each team member creates their own Descartes' Square, answering the key questions and noting their ideas.
- Share and Consolidate Ideas. Team members present their squares. Record overlapping answers, reasonable suggestions, and standout ideas on the shared square.
- Make a Final Decision. Agree on the best course of action as a team and communicate the decision to all stakeholders.
Advantages and Disadvantages
✅ Advantages:
- Simplicity. With just a few questions and criteria, the method is easy to implement.
- Thorough analysis. Encourages consideration of all potential outcomes, including less obvious ones.
- Risk mitigation. Highlights negative scenarios, enabling proactive prevention or minimization.
- Action-oriented. Motivates prompt decision-making instead of delaying solutions.
❌ Disadvantages:
- Subjectivity. Decisions can be influenced by personal biases, which may skew judgment.
- Not for urgent issues. The method is less suitable for time-sensitive problems requiring immediate action.
- Limited adaptability. Doesn’t account for unexpected factors or rapidly changing circumstances.
- Time-intensive. Complex situations require more time for thorough analysis.
Stakeholder Analysis Map and RACI/DACI Matrices
A stakeholder analysis map visually represents individuals or groups who have an interest in a project, product, or idea.
Common Uses:
- Launching a new product.
- Entering a new market.
- Running marketing campaigns.
In essence, it’s a tool for understanding the players on the field in any given scenario.
Once stakeholders are identified, the RACI and DACI matrices help allocate responsibilities effectively:
- RACI. Identifies who is Responsible, Accountable, Consulted, and Informed for specific tasks and deliverables. It’s a staple in project management.
- DACI. Clarifies who drives, approves, contributes, and informs decision-making in various scenarios. It’s particularly useful in IT product and software development.
Though typically used in professional settings, these matrices can also be applied to everyday situations — like figuring out who’s in charge of bringing what to a barbecue😊
Combining Stakeholder Maps and Responsibility Matrices. The stakeholder analysis map and responsibility matrices complement each other to:
- Define the team composition.
- Facilitate clear and effective communication.
- Create a strong, actionable value proposition.
These tools work in tandem:
- The stakeholder map provides the foundation for building responsibility matrices.
- The responsibility matrices help pinpoint and refine the roles of key stakeholders.
How It All Works
To analyze stakeholders effectively, start by identifying who they are. Here's how:
- Identify interested parties. Determine who has an interest in the project and who can influence it—either by approving or rejecting it.
- Assess their level of influence. For example, sponsors typically have a high level of influence.
- Understand their needs. What do stakeholders want from the project? How should you communicate with them to meet their expectations?
- Provide regular updates. Keep stakeholders informed about project progress, changes, and key decisions. Seek their input when needed.
Example. Imagine you run a large grocery store in a rural area, and you plan to pave a stretch of road from the highway to your store. Stakeholders can be divided into two groups:
- Investors. Who they are — Financial backers of the project. What they want — A clear return on investment, timely project updates, and evidence that the project will drive customer traffic.
- Community. Who they are — Local residents and potential customers. What they want — Improved access to the store without disrupting daily life during construction. Who they are — Financial backers of the project.
By identifying and addressing the needs of these groups, you can align their expectations with the project goals and ensure smoother execution.
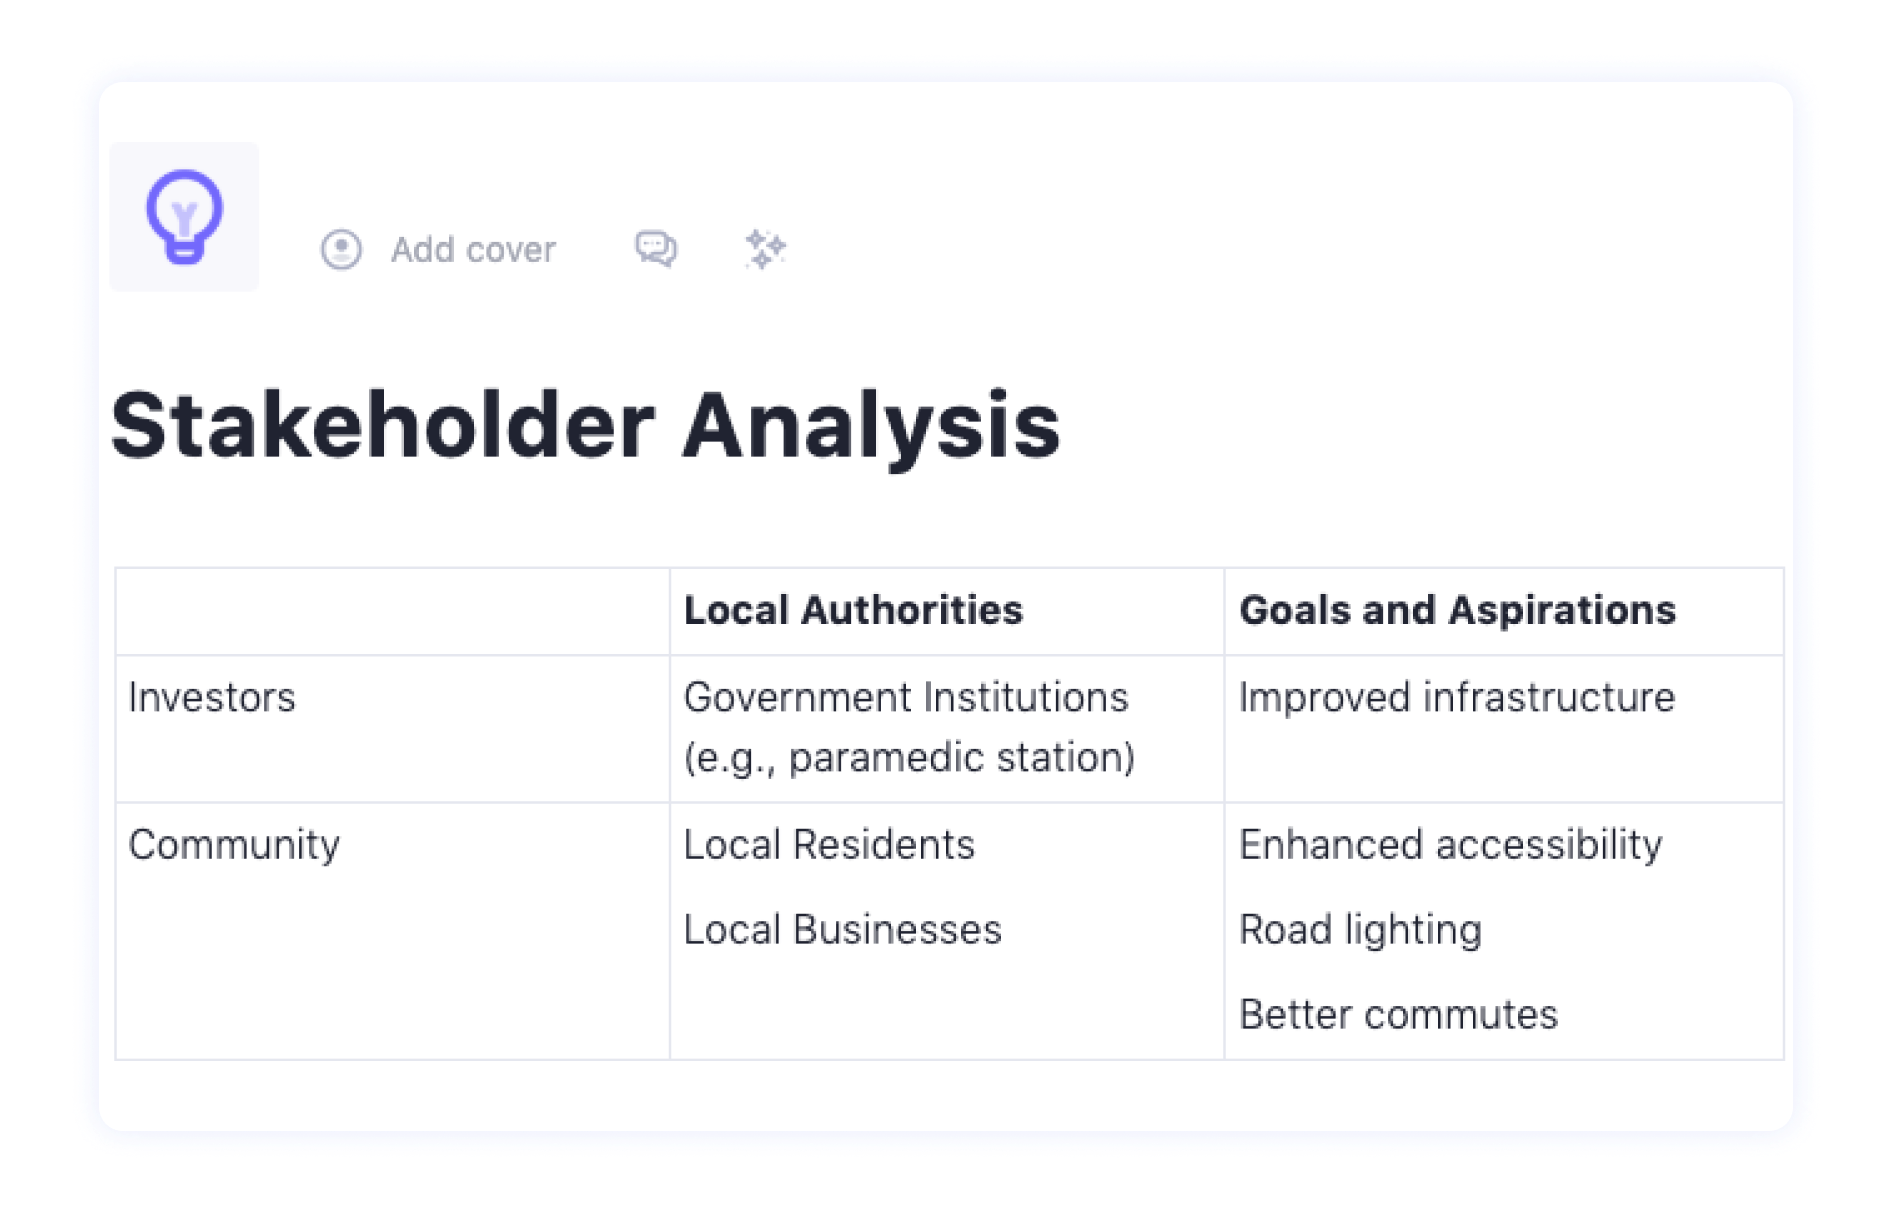
RACI Matrix for Road Construction Project
The project involves tasks like surveying and laying out the road section, preparing the budget, and conducting earthworks, including drainage systems, road bedding, and final surface installation.
👤 Project Participants:
- Contractor
- Crew and Foreman
- Engineers
- Architect
- Local Administration
Key Roles in the RACI Matrix
- R (Responsible). Those directly executing tasks (e.g., contractor, crew, engineers).
- A (Accountable). Supervisors overseeing the work and ensuring its completion (e.g., foreman, engineers).
- C (Consulted). Experts providing input or guidance (e.g., architect).
- I (Informed). Individuals or groups who need project updates (e.g., local administration).
This structure ensures clarity in responsibilities, smooth communication, and efficient project management.
Advantages and Disadvantages
✅ Advantages:
- Stakeholder analysis. Identifies everyone involved in the project and evaluates their influence, making it easier to understand who can support or obstruct the project.
- RACI and DACI matrices. Clearly define responsibilities, helping participants understand their roles and know who to approach for assistance or decisions.
❌ Disadvantages:
- Limited scope. These matrices do not cover all project processes in detail.
- Incomplete stakeholder list. Critical stakeholders might be overlooked, or unnecessary individuals could be included, leading to inefficiencies.
- Time-intensive for large projects. Large-scale projects with numerous participants result in complex and lengthy matrices, requiring significant effort to compile.
- Requires updates in emergencies. Unexpected changes or emergencies can necessitate reworking the matrices, adding to the workload.
| Difficulty of use | Difficulty in applying to large-scale projects or ideas | Use in project management | Use in personal life | |
|---|---|---|---|---|
| The Pugh Matrix | ⭐ | ⭐⭐⭐⭐ | ⭐⭐⭐ | ⭐⭐⭐ |
| The Eisenhower Matrix | ⭐⭐⭐ | ⭐⭐ | ⭐⭐ | ⭐⭐⭐⭐ |
| Comparison Matrix | ⭐ | ⭐⭐⭐ | ⭐⭐⭐⭐ | ⭐⭐⭐⭐ |
| Stakeholder Analysis Map and RACI/DACI Matrices | ⭐⭐⭐⭐ | ⭐⭐⭐⭐ | ⭐⭐⭐⭐ | ⭐ |
| Descartes' Square | ⭐⭐ | ⭐⭐ | ⭐⭐⭐ | ⭐⭐⭐⭐ |
Conclusion Matrix
✅ Matrices effectively visualize and assess various options, incorporating multiple criteria and potential solutions. They consolidate all relevant data and insights into a single, comprehensive table.
✅ In project management, matrices help identify the optimal solution, define roles, and prioritize tasks. They serve as valuable tools for aligning teams, mitigating risks, and fostering better collaboration.
✅ The Pugh Matrix, Eisenhower Matrix, Comparison Matrix, and Descartes' Square work well for both projects and personal use. In contrast, the Stakeholder Analysis Map and RACI/DACI matrices are more complex and designed specifically for project management.


