What is a Gantt Chart and How to Use It
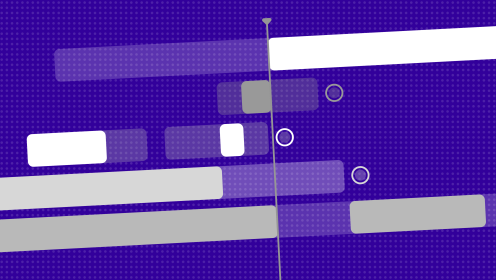
A Gantt chart is a project management tool designed to help organize and visualize personal or team projects.
The chart aids in visualization and allows you to:
- Establish the order of task completion,
- Estimate time and workload for each team member,
- Highlight priorities and relationships between different stages,
- Identify critical points that directly impact the project.
For personal use, it is an excellent self-management tool, and for team work, it acts as a lifeline. It helps manage tasks efficiently, clearly delineates projects, and accounts for each team member's working hours.
For guidance on how to create a Gantt chart and what to consider during the process, check out this recommended article. It's a great starting point if you're new to the topic.
Now, addressing one of the most popular queries, "Where can I create a Gantt chart?" let's dive into a selection of services. We'll briefly overview their main features and visual execution.
WEEEK
Traditionally, we'll start with our planner. It's a comprehensive remote office where you can collaborate with your team, plan tasks, monitor their progress, and create Gantt charts. If you need a universal program, this is the place to go.
Available Plans for Gantt Chart Creation
Gantt charts are available on all plans, including the free one. However, it’s more convenient to use the chart starting from the Lite plan, where you can create extended tasks (from $3.99 per month per user).

Interface Features
- Displays task and subtask names on the sidebar and the chart itself
- Completed tasks are crossed out on the chart and marked with checkmarks on the sidebar
- The chart shows the completion time, task dependencies, constraints, and dates
- Additionally, the sidebar displays task priority (by color) and the executor's avatar
Capabilities
- Quickly create and format tasks both on the chart and the sidebar
- Make tasks private
- Add additional materials, comment on tasks, and view change history
- Set dependencies between tasks, block one task until another is completed
- Move the timeline directly on the chart
- Scale the display of tasks by days, weeks, and months
- Change a subtask's status to a main task's status
- Sort by priority, date, type, and estimated time
Limitations / Not Yet Available
- No separate visualization for milestones (key project stages)
- Task progress is not displayed on the chart
- Task coloring is not yet available
- Tasks cannot be manually moved on the sidebar (new tasks are created at the bottom)
- Days of the week are not indicated
Planfix
Another versatile service for large teams and projects with the capability to build Gantt charts. Planfix offers a wide range of features.
Available Plans for Gantt Chart Creation
The free plan has limitations on the number of employees (up to five) and projects (up to 10). If you fit within these limits, you can create Gantt charts at no cost. The minimum paid plan starts at €3 per employee.

Interface Features
- Displays task and subtask names on the chart and sidebar
- On the chart: tasks in progress, completed tasks, overdue tasks (in different colors); dependencies between tasks, executor in First Name Last Name format, dates, and days of the week
- On the sidebar: start date, end date, and task duration in days; priority (by color)
Capabilities
- Edit start and end dates on the sidebar and chart
- Filter tasks and manually move them on the sidebar
- Set dependencies between tasks and assign statuses, but only in advanced editing
- Scale task display in hours, days, weeks, and months
- Set and manage milestones
- Specify exact times for task execution (from and to) or the number of hours
- Require result verification before marking a task as complete
- Create summary tasks, where the duration of a specific task is automatically calculated based on the durations of its subtasks (a big plus for simplifying life)
Limitations / Not Yet Available
- Cannot quickly edit task statuses
- There's a separate "urgent" task status, but it doesn't display on the panel
- The button to create a subtask is hard to find (hint: it's within the advanced task editing)
- No clear distinction between tasks and subtasks on the sidebar
- No display of task progress stages
Wrike
A popular international planner for flexible project management, including a visually appealing Gantt chart. It is a simple and intuitive system.
Available Plans for Gantt Chart Creation
Gantt charts are available starting from the Team plan ($9.80 per user per month)/

Interface Features
- Task and subtask names on the panel and chart
- Task status: on the chart — by colors, on the panel — by label
- On the chart: task dependencies, executor by name, dates and days of the week, milestones
- On the panel: priority (low, medium, high); start date and due date
Capabilities
- Create and format tasks on the sidebar
- Set task dependencies (predecessor or successor)
- Change dates or move the timeline directly on the chart
- Scale the project by days, weeks, months, quarters, and years
- Specify the number of days required to complete a task
- Filter tasks by priority, date, or status on the sidebar, and manually rearrange them
- View task change history
- Prevent planning on weekends (a plus in my book)
- Collapse the sidebar to fully appreciate the Gantt chart visualization
- Add and manage milestones
- Require result verification before marking a task as complete
- Set privacy for guest users
- Export and import in xlsx and pdf formats (useful for presentations)
Limitations / Not Yet Available
- No option to set task start and end times
- You can create tasks on the sidebar, but you can only edit dates and efficiency, not the text itself
- Task progress is not displayed on the chart
ClickUp
A task and project management platform with automation and real-time collaboration. It includes a mobile app that displays the Gantt chart, perfect for checking project progress even if you wake up in a cold sweat in the middle of the night.
Available Plans for Gantt Chart Creation
The free plan includes the Gantt chart feature. It allows up to 60 users in the workspace, but data storage is limited to 100 MB. If you need more storage, it costs $7 per person per month with annual payment.

Interface Features
- Task and subtask names on the panel and chart
- On the chart: deadlines, task dependencies, executor initials, dates with weekend display
- On the panel: customizable elements based on user preferences
Capabilities
- Create, move, and quickly edit tasks on the sidebar
- Set task dependencies directly on the chart
- Assign task statuses and milestones, but only in advanced editing
- Scale task display by days, weeks, months, and years
- Set specific task execution times (from and to) or the number of hours
- Indicate task priority
- Receive email notifications
- Extensive sorting options
- Snapshot feature for comparing and tracking progress or using in presentations
- View the time gap until the next task (with dependency) or until the final task, indicated by markers on the chart
Limitations / Not Yet Available
- Task priority is not displayed on the chart or sidebar
- Milestones are also not displayed on the chart
- Progress stages are visible only for the entire project
GanttPRO
GanttPRO is a resource that allows extensive customization of Gantt charts, offering various settings, colors, statuses, filtering, and display options. It's a popular system supporting export from files in xlsx, csv, mpp formats, and from Jira.
Available Plans for Gantt Chart Creation
You can test the program for 14 days for free without any feature restrictions. After that, you need to switch to a paid plan. The simplest plan costs $7.99 per month and includes most features: Gantt chart creation, templates and their auto-filling, task linking, filtering, etc. However, even the minimal plan has some limitations.

Interface Features
- Task and subtask names on the chart and sidebar
- Executor in "First Name Last Name" format on the sidebar and initials on the chart
- On the chart: deadlines and progress, task dependencies, milestones
- On the sidebar: task status and priority. Parameters are provided by default. Display elements on the sidebar and chart can be flexibly customized.
Capabilities
- Start and finish of the main task depend on subtasks, and their time frames can be adjusted on the chart
- Task positions are automatically corrected when setting dependencies
- Contrast highlighting of main tasks and subtasks on the chart
- Chart scaling by years, quarters, months, weeks, days, and even hours
- Mass formatting and task numbering
- Set the lag time for the next task to start after the previous one ends or parallel dependent tasks
- Set specific task execution times (from and to) or the number of hours
- Choose task color and priority level (from lowest to highest)
- Many filters available for task display
- Quick parameter editing on the sidebar
- Task progress is adjusted on the chart in %
- Highlight overdue tasks with one click
- Email notifications and export in pdf, png, xlsx, xml formats
- The main perk — you can upload an Excel file or Google Sheet with a list of tasks and deadlines, and the service will automatically build a chart based on the document
Limitations / Not Yet Available
- Days of the week are not displayed on the chart
- Sorting is available either manually (dragging tasks) or cascaded — by date
- Change history is available not for individual tasks but for the entire project
Team Gantt
Another tool focused specifically on Gantt charts. It is somewhat simpler than the previous one and has a soft, user-friendly interface. It supports export in pdf, xlsx, csv, or png formats. If you intend to use Gantt charts as your primary tool, this is a good choice.
Available Plans for Gantt Chart Creation
The free plan allows you to create only one Gantt chart and connect up to three users, including the creator. There are also limitations on task formatting. The standard plan at $19 per month per user removes these limitations. Higher-tier plans offer additional features.

Interface Features
- Deadlines and progress on the chart and sidebar
- Executor in First Name Last Name format on the sidebar and chart
- On the chart: task dependencies, milestones, dates, and days of the week
- On the sidebar: task and subtask names
Capabilities
- Hide completed tasks with a single click
- Choose task colors and sort by them
- Set time frames and dependencies directly on the chart
- Adjust task progress on the sidebar and display it on the chart
- View change history for specific tasks
- Contrast separation of main tasks and subtasks on the chart and sidebar
- Quick task parameter editing on the sidebar
- Extensive task display filtering options
- Time tracking and employee workload table (available only on the paid plan)
- Email notifications and export in pdf, xlsx, csv formats
Limitations / Not Yet Available
- No option to scale the project by months, days, and years
- Can only create groups with subtasks; creating individual subtasks is not available
- The mobile app does not have a project timeline view
Miro
Miro is an endless interactive digital whiteboard, making it distinct from the other tools listed. It features a minimalist Gantt chart template. Though not the most automated service, it allows for highly detailed customization.
Available Plans for Gantt Chart Creation
Free up to three boards, with unlimited Gantt charts on those boards. However, the functionality is significantly limited, with few integrations with external services. The full feature package starts at $16 per month per user with annual payment.

Interface Features (on the Template)
- Task names in the form of stickers
- Start and finish of each task and subtask (beside or below the task itself)
- Task dependencies and connections
- Milestones with customizable formats
- Task status (at the bottom of the sticker)
Capabilities
- Wide range of color options for tasks, subtasks, arrows, fonts — almost everything
- Flexible formats and sizes for various elements
- Add and remove columns, rows, stickers, arrows — as per the plan
- Set task status (new, in progress, completed)
- Start and finish times on the sidebar or within the task card
- Add links within the task card
- Attach various files on the board — like stickers, photos
- Multiple projects, diagrams, and mind maps can be anchored on one board
- Import data from other project management systems (extended functionality only on paid plans) In essence, you can customize everything as you wish, but it requires manual effort.
Limitations / Not Yet Available (and Unlikely to Be Added)
- No automation whatsoever
- No time tracking or filtering
- Dependencies are unavailable in the free and the cheapest plans
- High-resolution board export for presentations only on paid plans
- Email notifications only for changes made
- No private mode
Smartsheet
Smartsheet is a versatile project management tool that combines the familiarity of spreadsheets with powerful collaboration and project tracking features. It offers a robust Gantt chart functionality, making it a strong choice for managing complex projects.
Available Plans for Gantt Chart Creation
Smartsheet offers a 30-day free trial with access to all features. After the trial, the basic plan starts at $14 per month per user, which includes Gantt chart creation, task dependencies, and basic project management features. Higher-tier plans offer additional functionality, such as advanced reporting and resource management.

Interface Features
- Task and subtask names on the chart and sidebar
- Start and end dates of tasks and subtasks
- Task dependencies and critical paths
- Milestones with customizable markers
- Task status and priority on the sidebar
Capabilities
- Create and format tasks directly on the Gantt chart
- Set dependencies between tasks with drag-and-drop functionality
- Scale the Gantt chart by days, weeks, months, and quarters
- Adjust task duration and timelines directly on the chart
- Use conditional formatting to highlight tasks based on status or priority
- Track task progress with percentage completion bars
- Collaborate with team members in real-time with comments and attachments
- Import and export project data in various formats, including xlsx, csv, and pdf
- Use built-in templates for quick project setup
- Integrate with other tools like Jira, Microsoft Office, and Google Workspace
Limitations / Not Yet Available
- Advanced resource management features are only available on higher-tier plans
- Custom reporting options are limited in the basic plan
- No offline mode; requires an internet connection to access and update projects
- Limited customization options for task appearance on the free plan
Microsoft Excel
We'll conclude with an offline tool that has existed since ancient times, or at least before the advent of modern services. Back then, all algorithms were manually assembled, and even now, you can find numerous templates for creating Gantt charts in good old Excel.
Available Plans for Gantt Chart Creation
For extensive features for large projects, you can use the paid MS Project. For simpler needs, regular Microsoft Excel is more than sufficient.

Interface Features
- On the chart: goals and milestones, dates and days of the week
- On the sidebar: names of main tasks and subtasks, start date of each task and subtask, number of days to complete, categories (task statuses), progress in %, executor's name
Capabilities
- Add or remove columns and rows
- Track time for tasks by days
- Set start time and number of days for completion
- Assign task statuses
- Import data from other project management systems and export to some services
Limitations / Not Yet Available and Unlikely to Be Added
- Minimal automation, dependent on the template and settings
- Offline version doesn't support multiple users working simultaneously (but you can transfer everything to Google Sheets)
- Attaching additional files is not available, but you can insert links
Summary
When choosing a service, consider your specific needs. Some may prioritize versatility, while others value a variety of tools.
- For multifunctional programs with Gantt, Kanban, task lists, and calendars, check out the first four services. They offer both free and paid options for teams of all sizes.
- For a Gantt-focused tool with extensive features, go for GanttPRO or TeamGantt.
- If you need a highly customizable service, Miro's interactive board is ideal.
- If you need an offline tool, standard Microsoft Excel is a great choice.


